
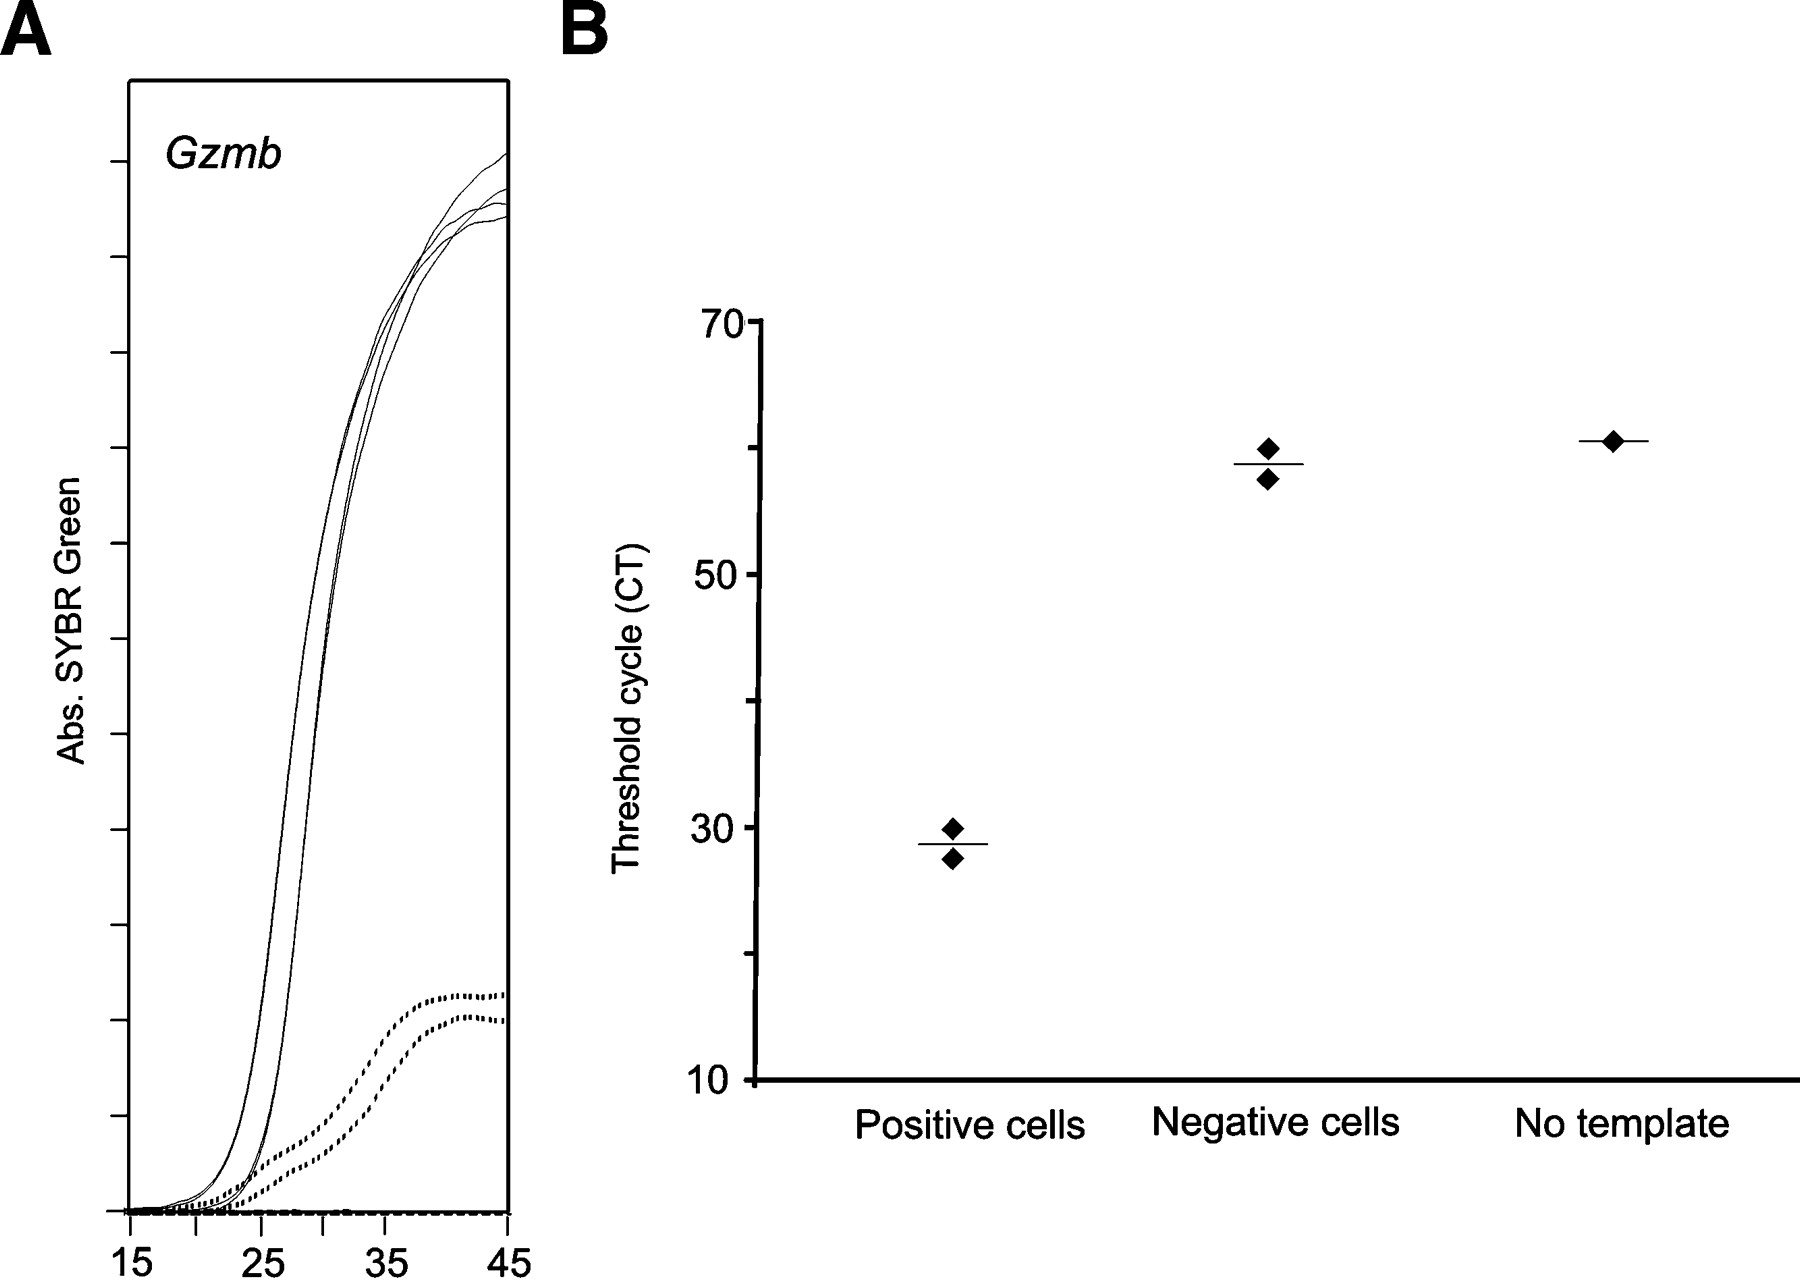
Figure 5
Impact of nonspecific signal in PCR quantification read-outs. Individual cells expressing or not Gzmb mRNA were amplified simultaneously. (A) SYBR Green signal in positive (solid lines) and negative (dotted lines) cells. (B) CT evaluation, using the Sequence Detector 1.7 software. The CT value of negative cells and wells not containing template was not significantly different (t-test: P = 0.18). This program's upper limit of detection is 60 cycles; that is, samples without template score with a CT of 60.


