
Figure 4
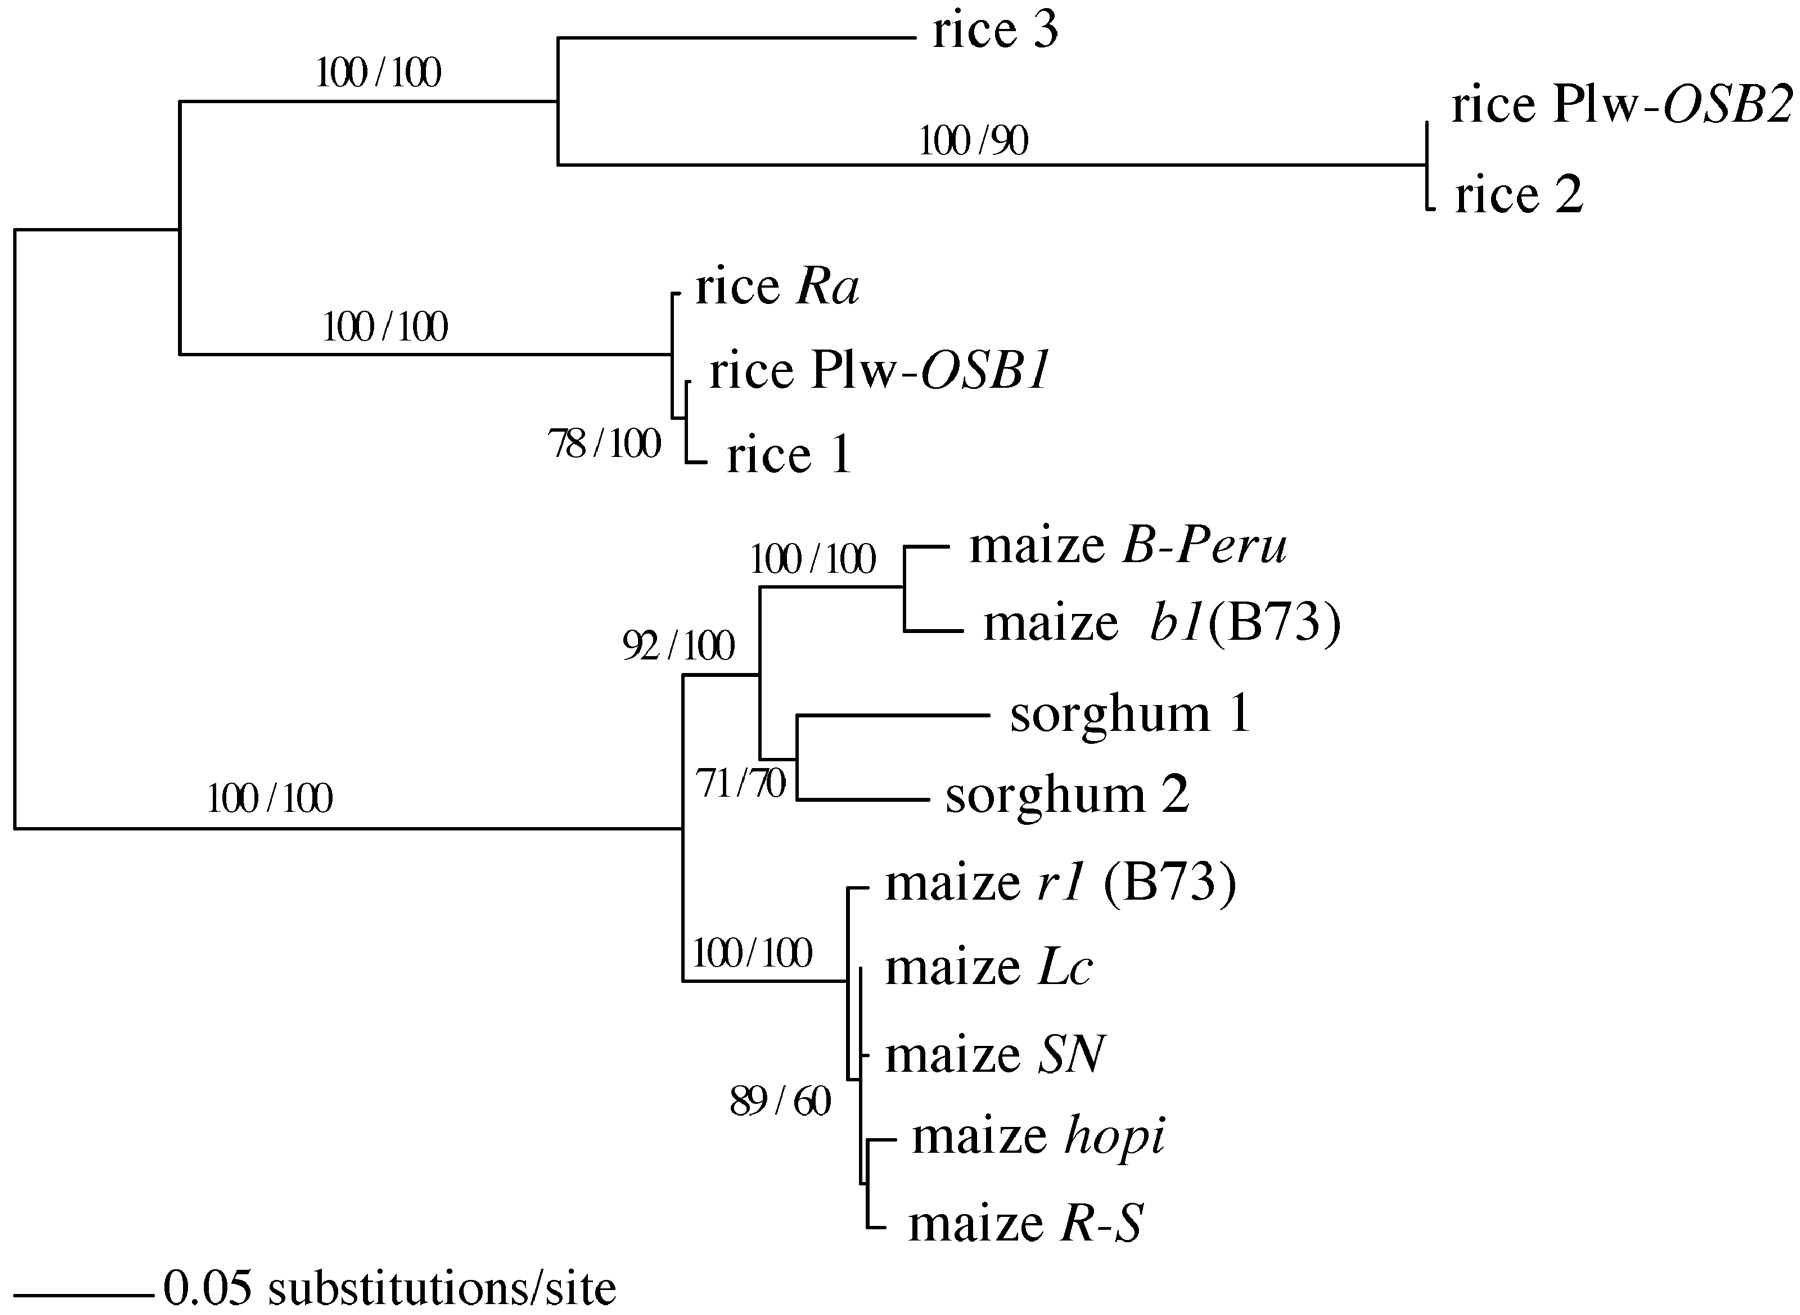
Phylogenetic relationships among r1/b1 gene homologs resulting from ML (GTR+I+G) analysis. The numbers at the internodes represent bootstrap proportions from MP/ML analyses.
(Downloading may take up to 30 seconds. If the slide opens in your browser, select File -> Save As to save it.)
Click on image to view larger version.
Phylogenetic relationships among r1/b1 gene homologs resulting from ML (GTR+I+G) analysis. The numbers at the internodes represent bootstrap proportions from MP/ML analyses.
 CiteULike
 Delicious
 Digg
Digg Facebook
 Google+
 Reddit
 Twitter
