
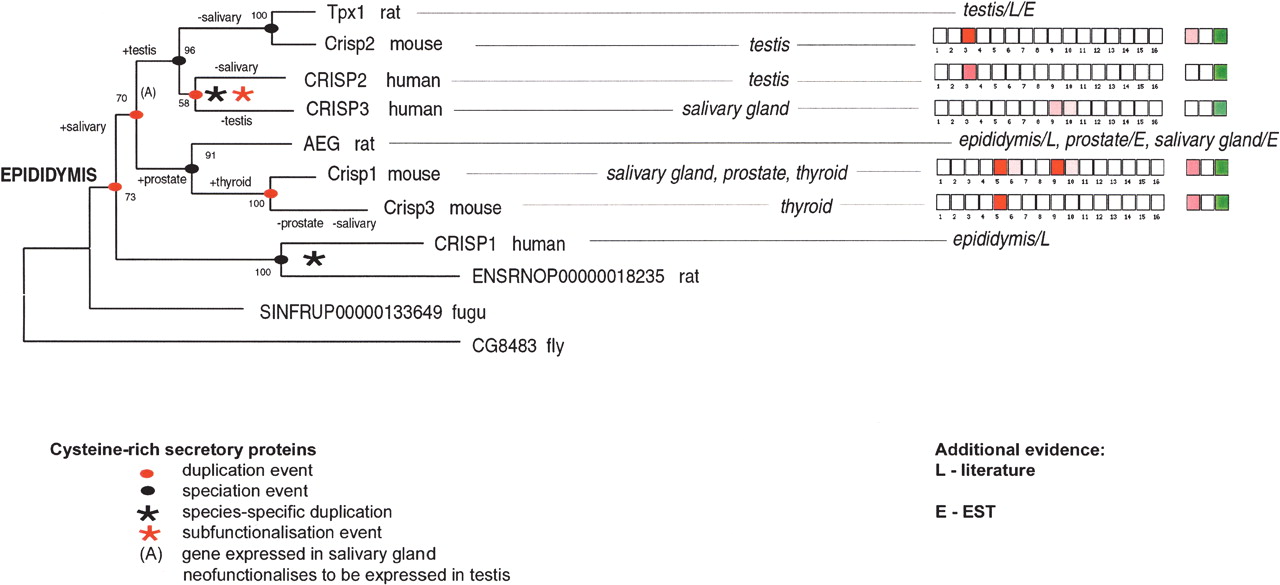
Phylogenetic relationships and expression profiles in the cysteine-rich secretory protein (CRISP) family. The phylogenetic tree was constructed by the minimum evolution method after CLUSTALW sequence alignment of protein sequences. Bootstrap values are shown. Human CRISP1, CRISP2, CRISP3, and mouse Crisp1, Crisp2, Crisp3, were compared with three rat genes: testis-specific protein 1, Tpx1 (Maeda et al. 1998; O'Bryan et al. 1998); epididymal glycoprotein, AEG (Charest et al. 1988); and an Ensembl novel gene prediction, as well as outgroups from Fugu rubripes and Drosophila melanogaster (used to root the tree). Where GEA data were not available (CRISP1 and all rat genes), expression evidence from the literature (L) or EST databases (E) was used. The numbering and color scheme for gene expression data is the same as in Figure 3.


