
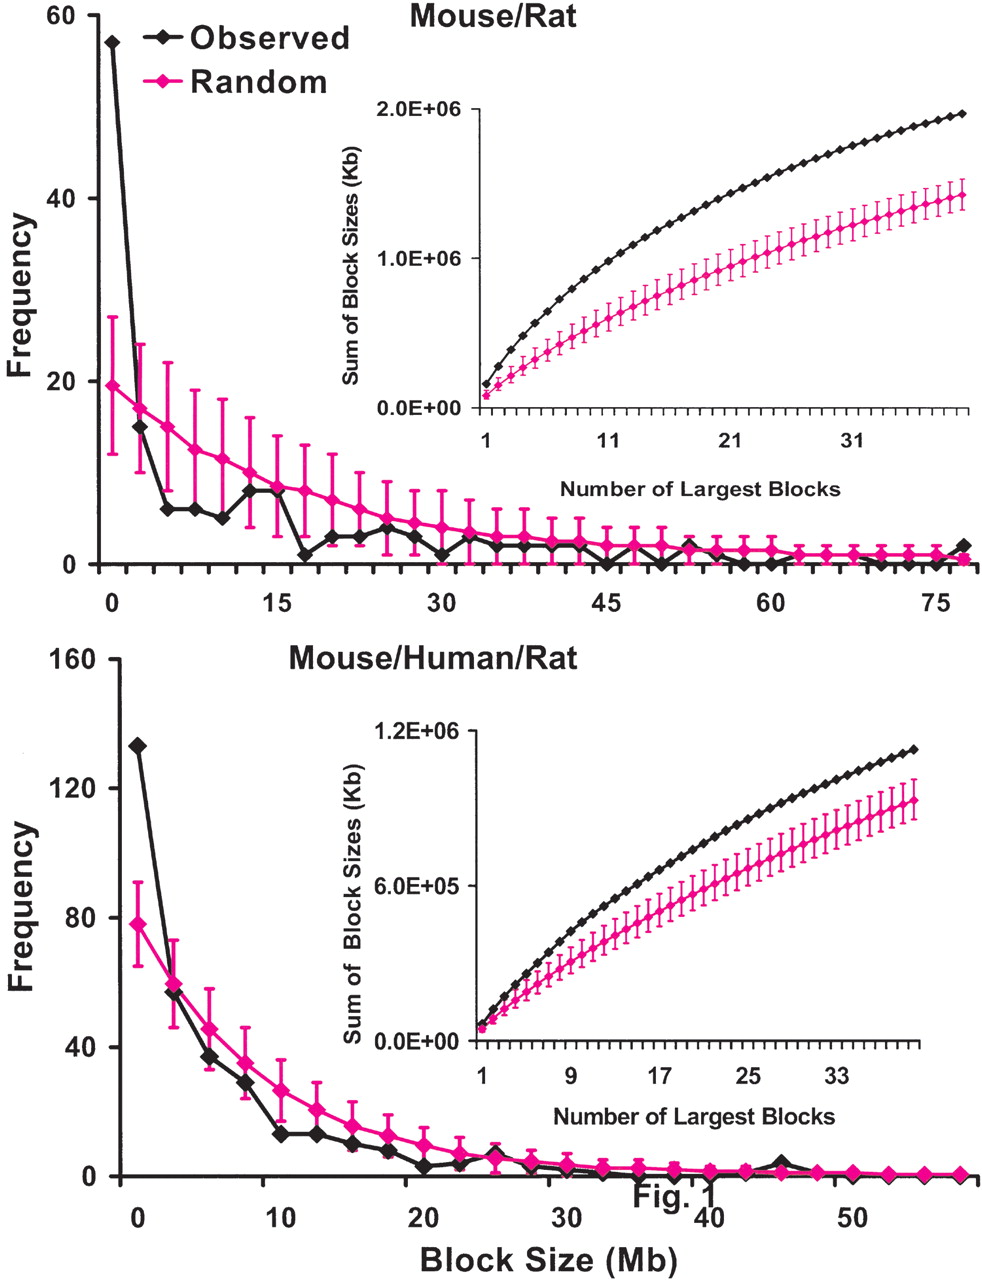
Syntenic block length distribution. The numbers of blocks with length above 100 kb in 2.5-Mb bins are plotted in blue. Expected values at 95% confidence for each bin on the basis of the Monte Carlo simulation of the random breakage model are plotted in pink. The data indicate that there are significantly more small blocks than what are predicated by the random breakage model, further confirmed by examining the distributions of the sum of sizes of the largest 40 blocks (as shown in the insets, the predicated values are smaller). (Top) The synteny between mouse and rat. (Bottom) The synteny among mouse, rat, and human. (Insets) Distributions of the sum of the lengths (kb) of the largest 40 blocks for the observed data (blue) and the predicated values at 95% confidence based on the random model (pink).


