
Figure 3
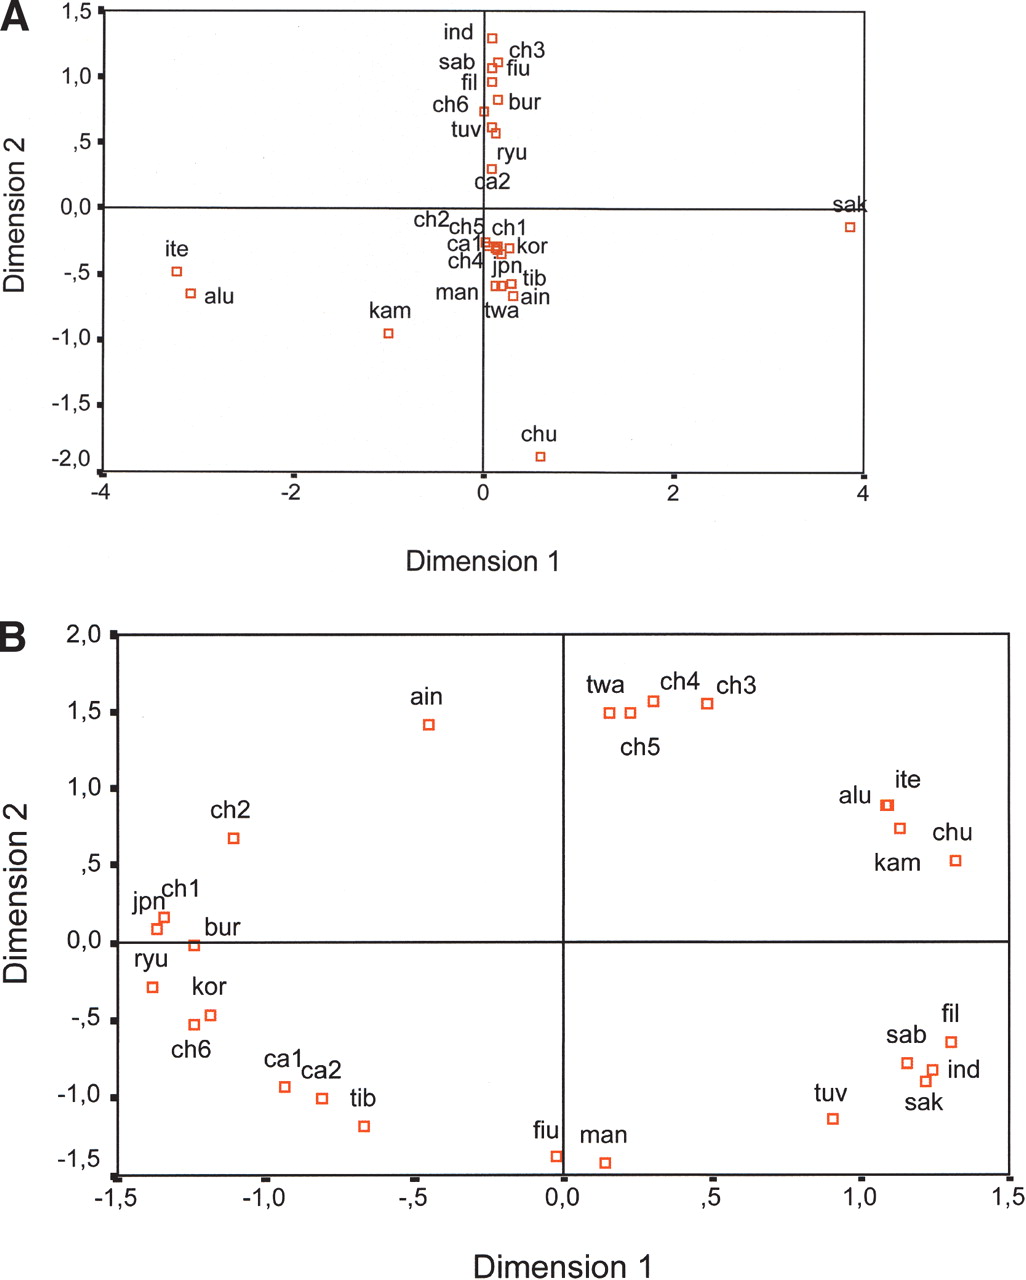
MDS plots based on (A) FST and (B) D match distances. Population groups are as detailed in Table 3.
(Downloading may take up to 30 seconds. If the slide opens in your browser, select File -> Save As to save it.)
Click on image to view larger version.
MDS plots based on (A) FST and (B) D match distances. Population groups are as detailed in Table 3.
 CiteULike
 Delicious
 Digg
Digg Facebook
 Google+
 Reddit
 Twitter
