
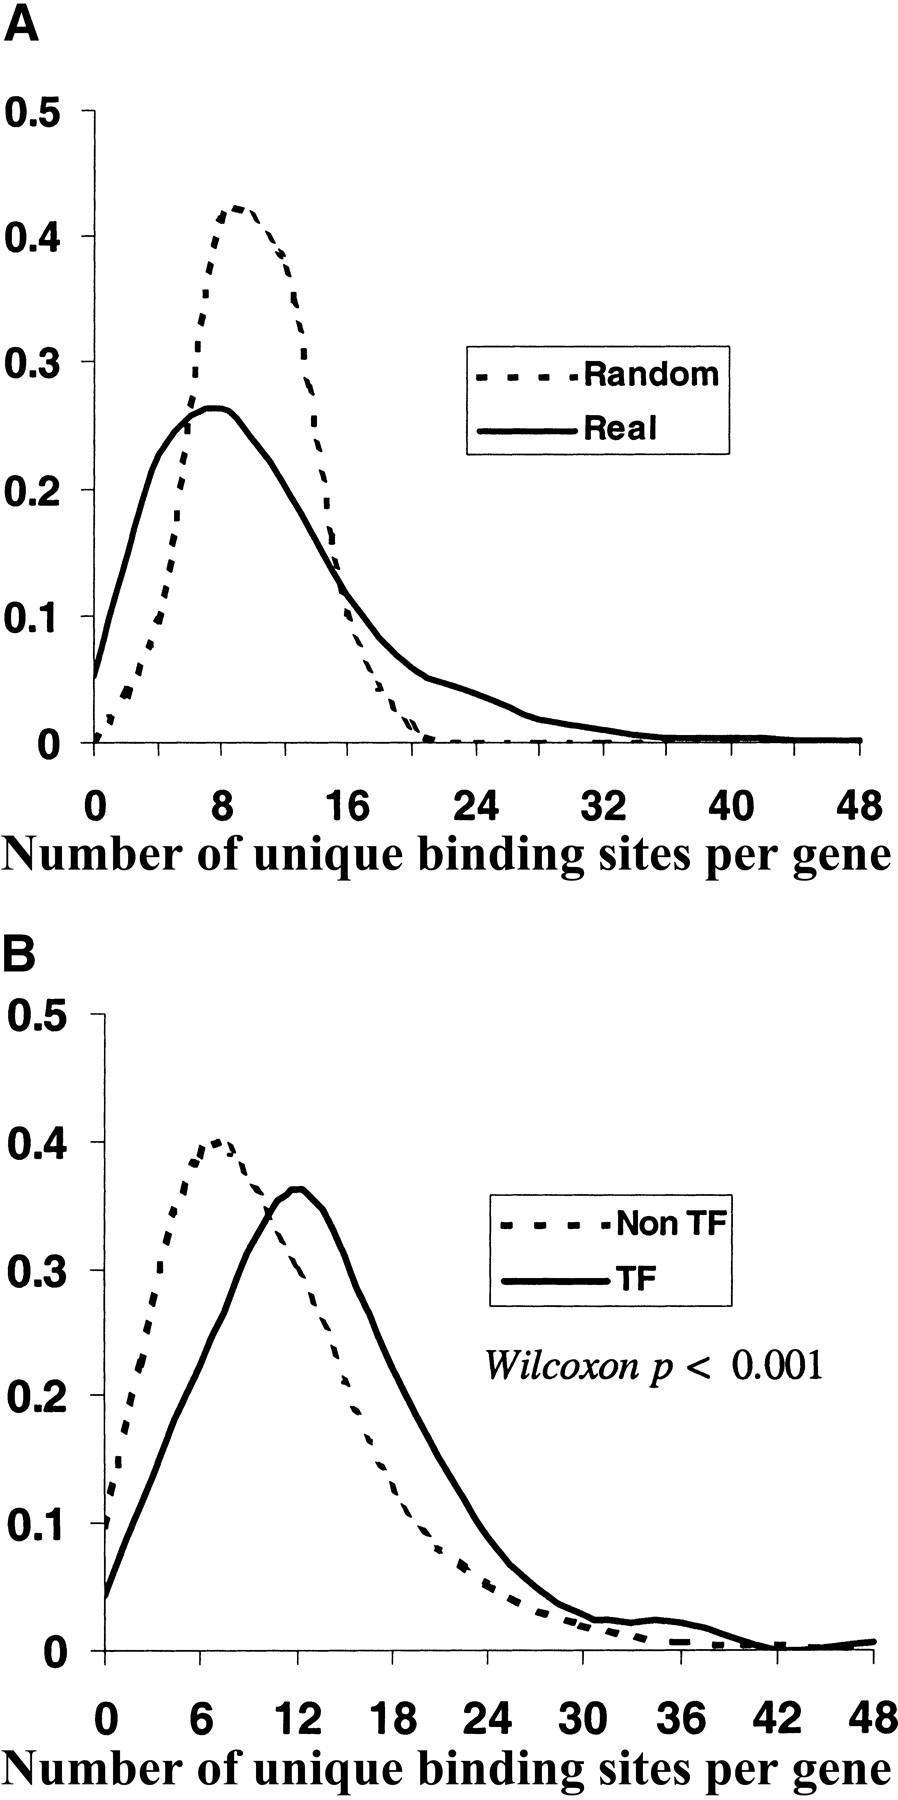
Figure 5
Connectivity distribution. (A) Distribution of the number of binding sites per upstream region for the 700 known and putative TF binding sites (solid line), and the same distribution for a randomly permuted connectivity matrix (dashed line). (B) The distribution for non-TF genes (dashed line), and for TF genes (solid line).


