
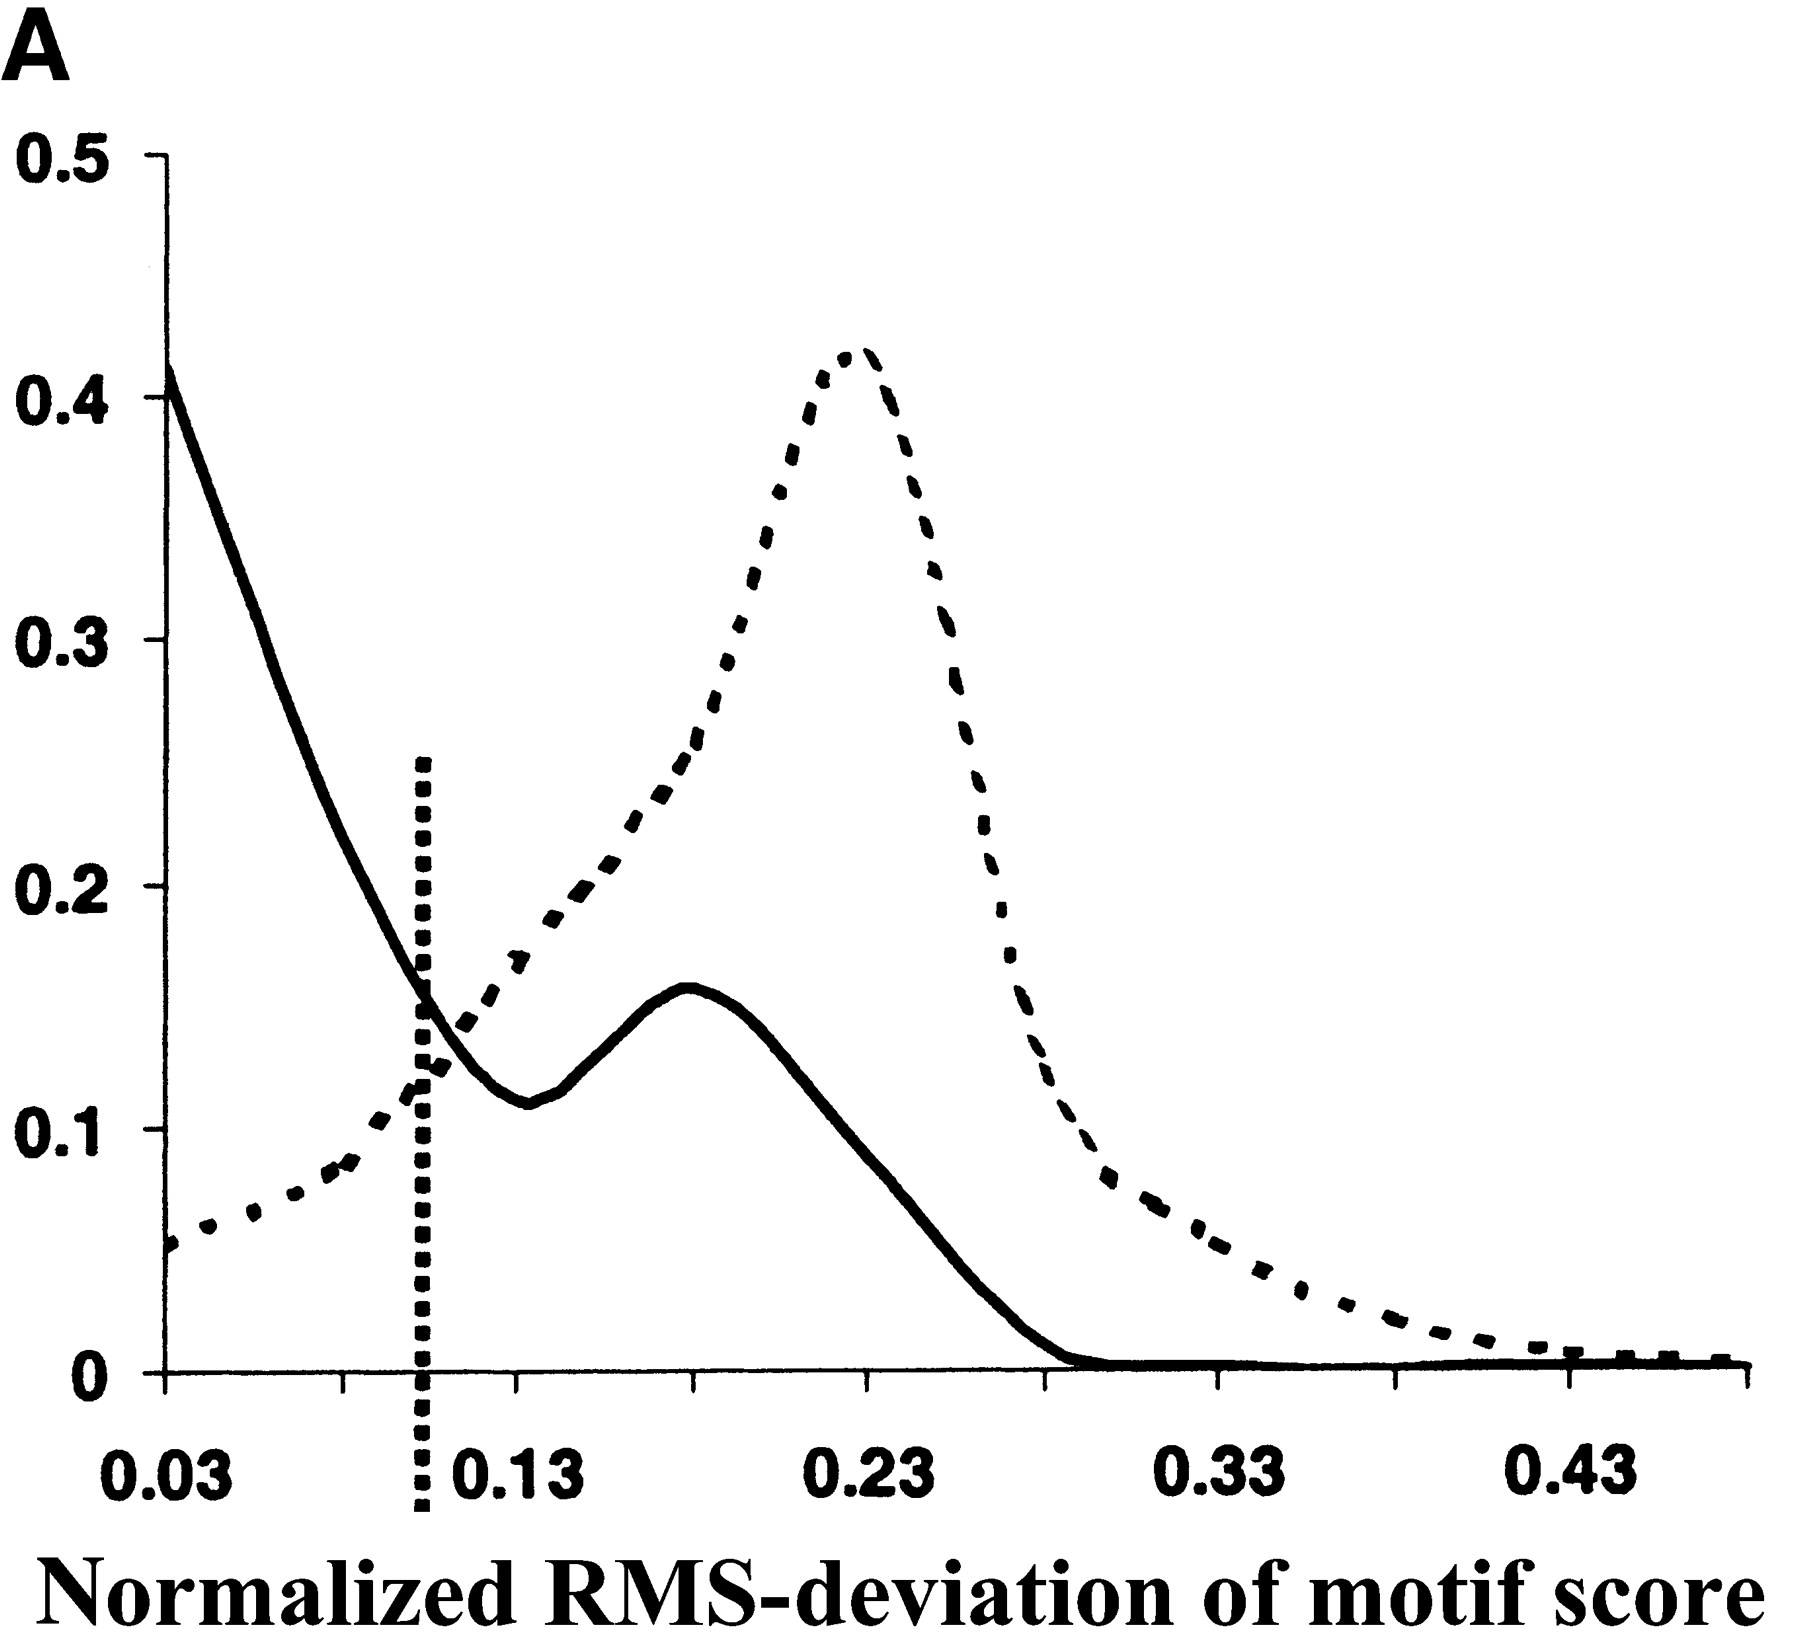
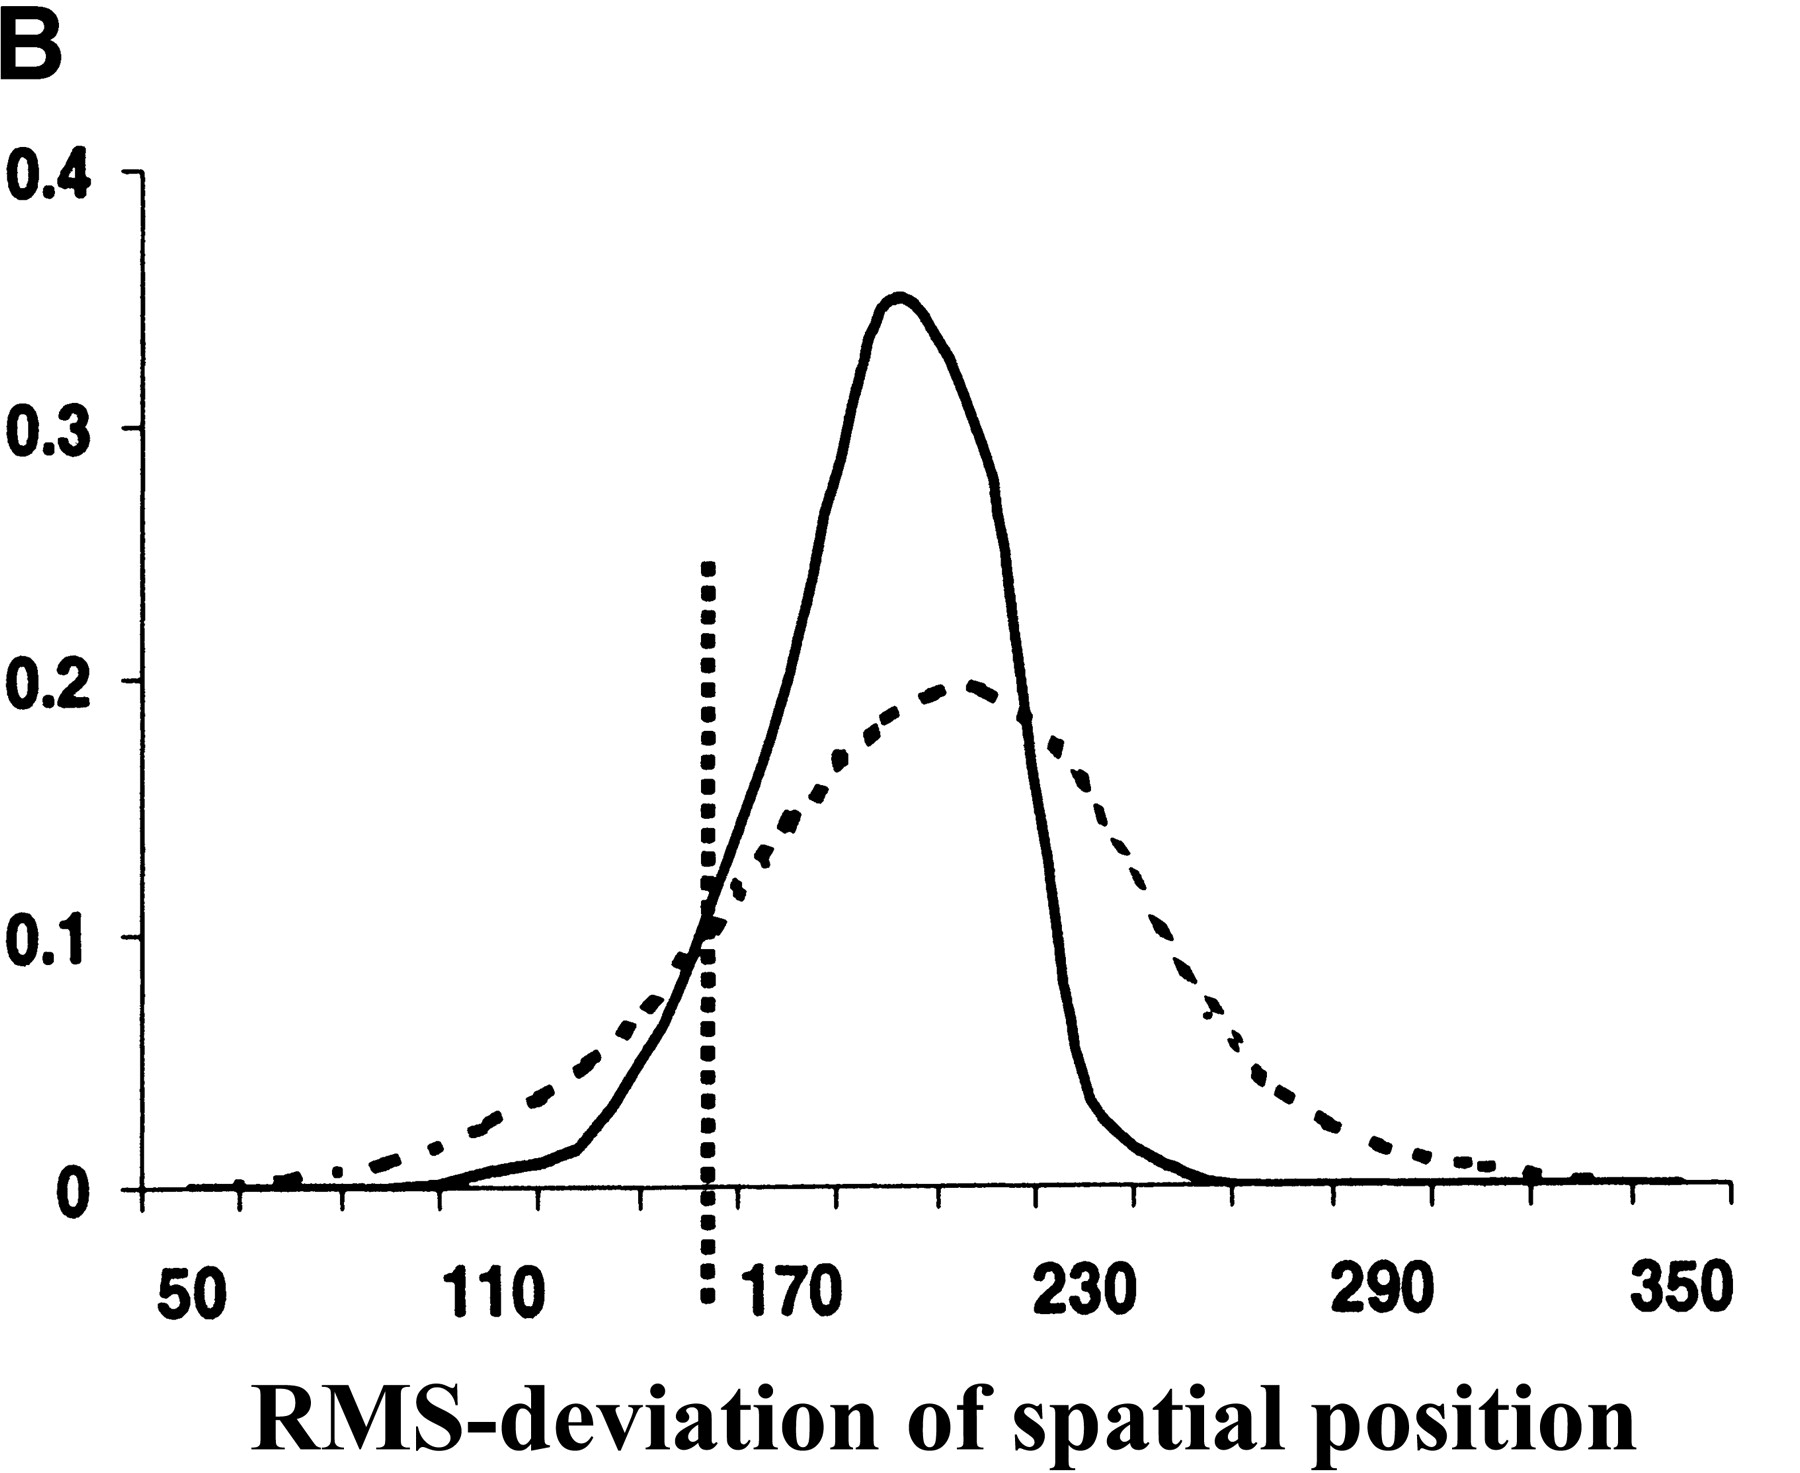
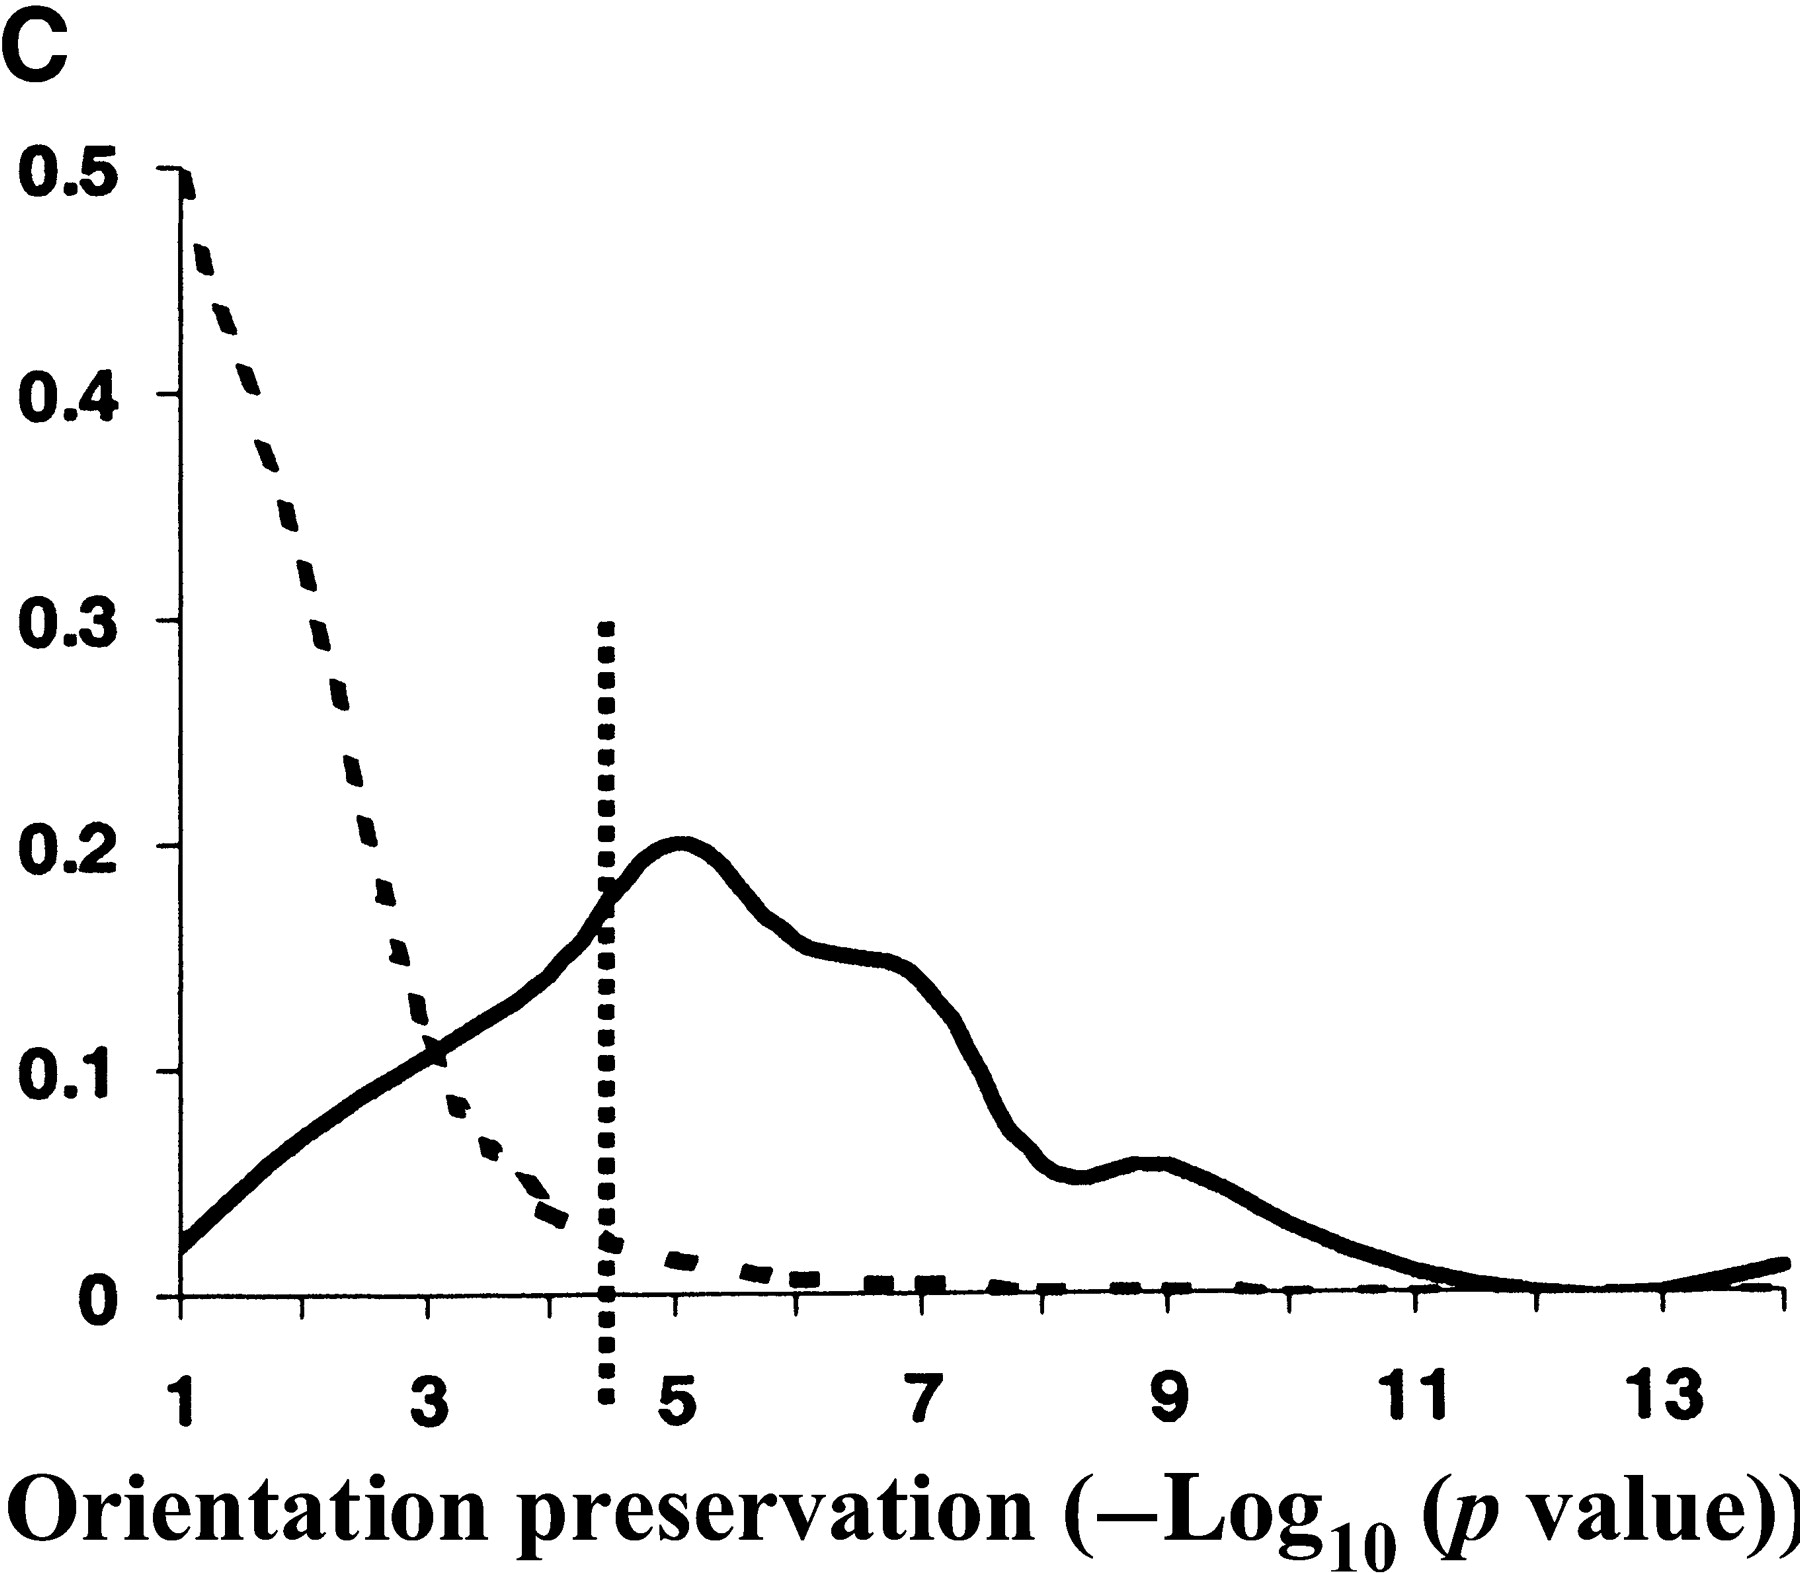
Evolutionary conservation of motif attributes. (A) Distribution of normalized RMS-deviation of motif scores for all 80,000 secondary motifs (dashed line) compared to the top motif predictions (network-level conservation P-value < 10-10; solid line). (B) Distribution of RMS-deviation in spatial position upstream of translational start for all the motifs (dashed line) compared to the most highly conserved (P < 10-10; solid line). (C) Distribution of P-values (binomial) for conservation of motif orientation for all of the 80,000 secondary motif predictions (dashed line), compared to the most highly conserved (P < 10-10; solid line). Vertical dashed line is the median value for strong matches to the 48 known TF binding sites.


