
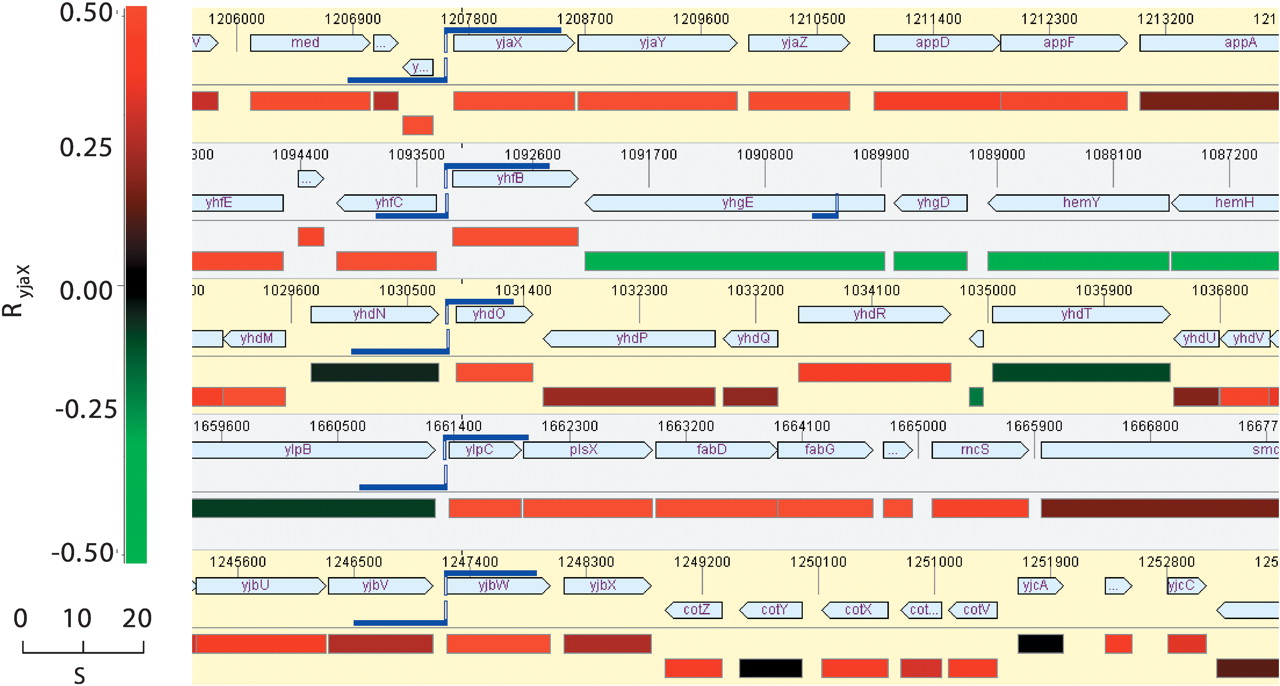
Genome expression correlation map of Bacillus subtilis. Five different regions of the complete genome sequence are displayed, together with color-coded mRNA expression correlations RyjaX (see the color scale; correlations R > 0.5 are displayed in the brightest red and green, respectively). Moreover, the locations of the conserved putative TFBS are shown (blue double-flags). The flag length indicates the score S reflecting the similarity to the TFBS consensus (see text), and the vertical blue lines indicate the position of the 21-bp-wide motif on the genome sequence (Phylosopher 4.0; Genedata). Note the appropriate locations of these motifs with respect to the operon head genes, consistent with their possible function as cis-regulatory elements, as well as the clearly correlated expression behavior of the genes located downstream, some of them representing larger operon structures (see Methods).


