
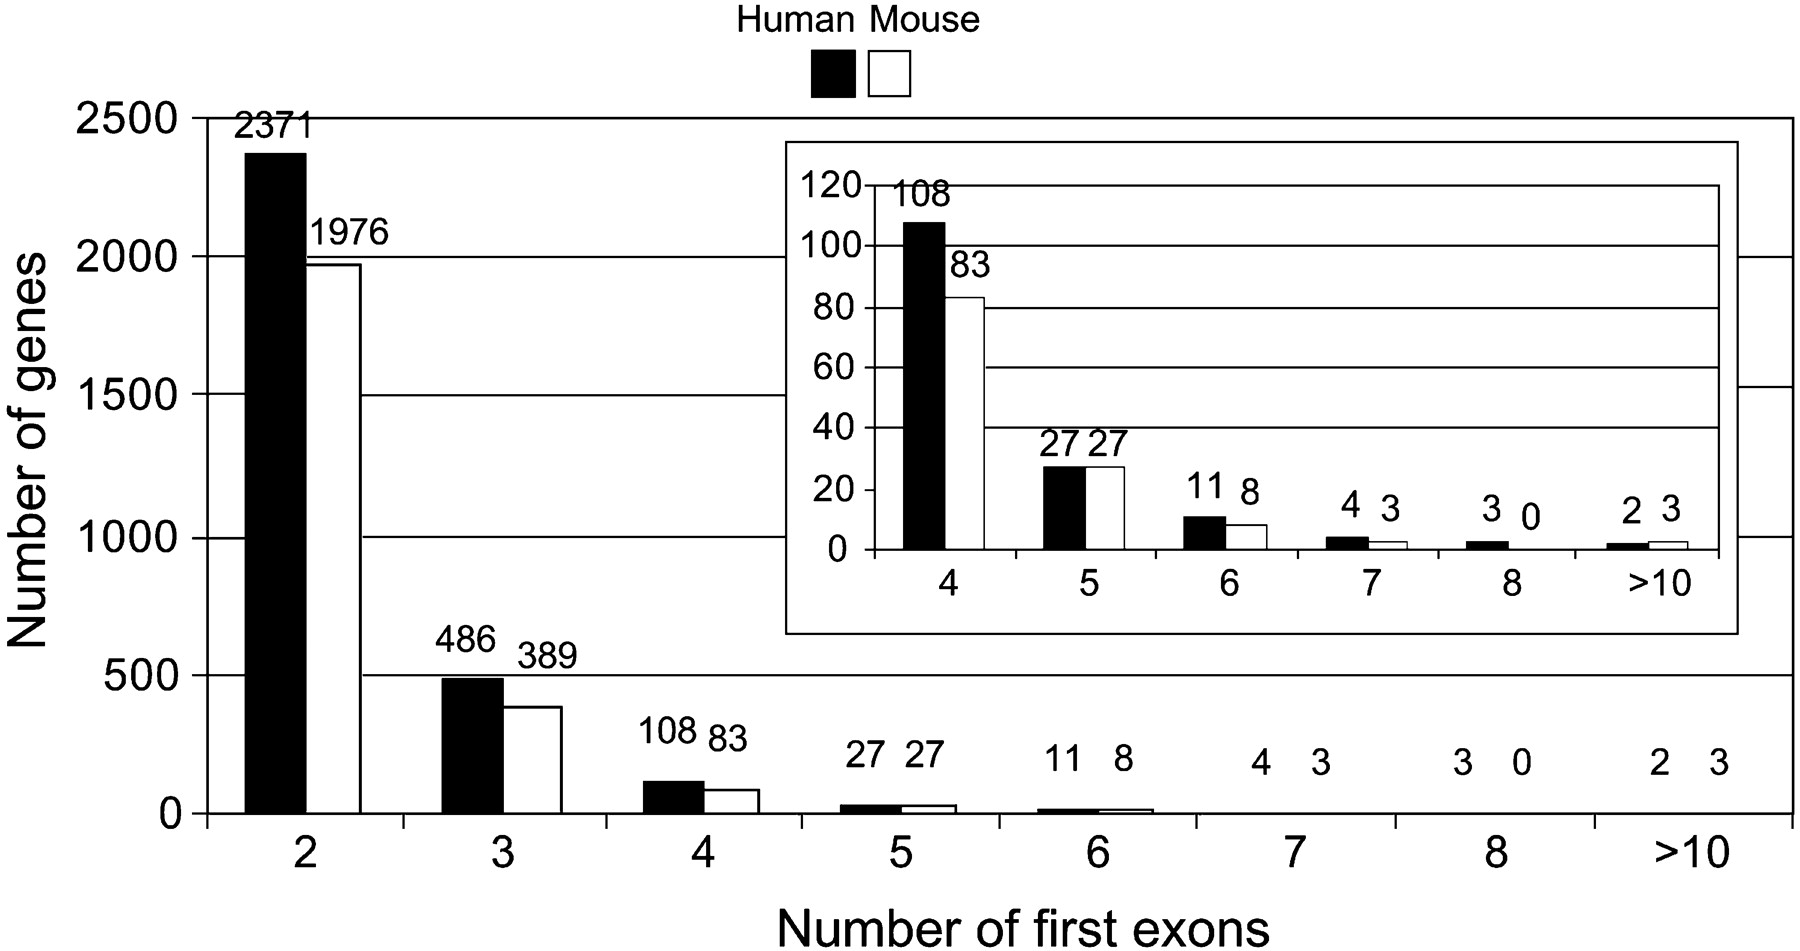
Figure 5
Genome-wide distribution of human and mouse genes that have more than one first exon. The numbers are shown above each histogram. The inset shows an enlargement of the distribution of genes with more than three first exons.


