
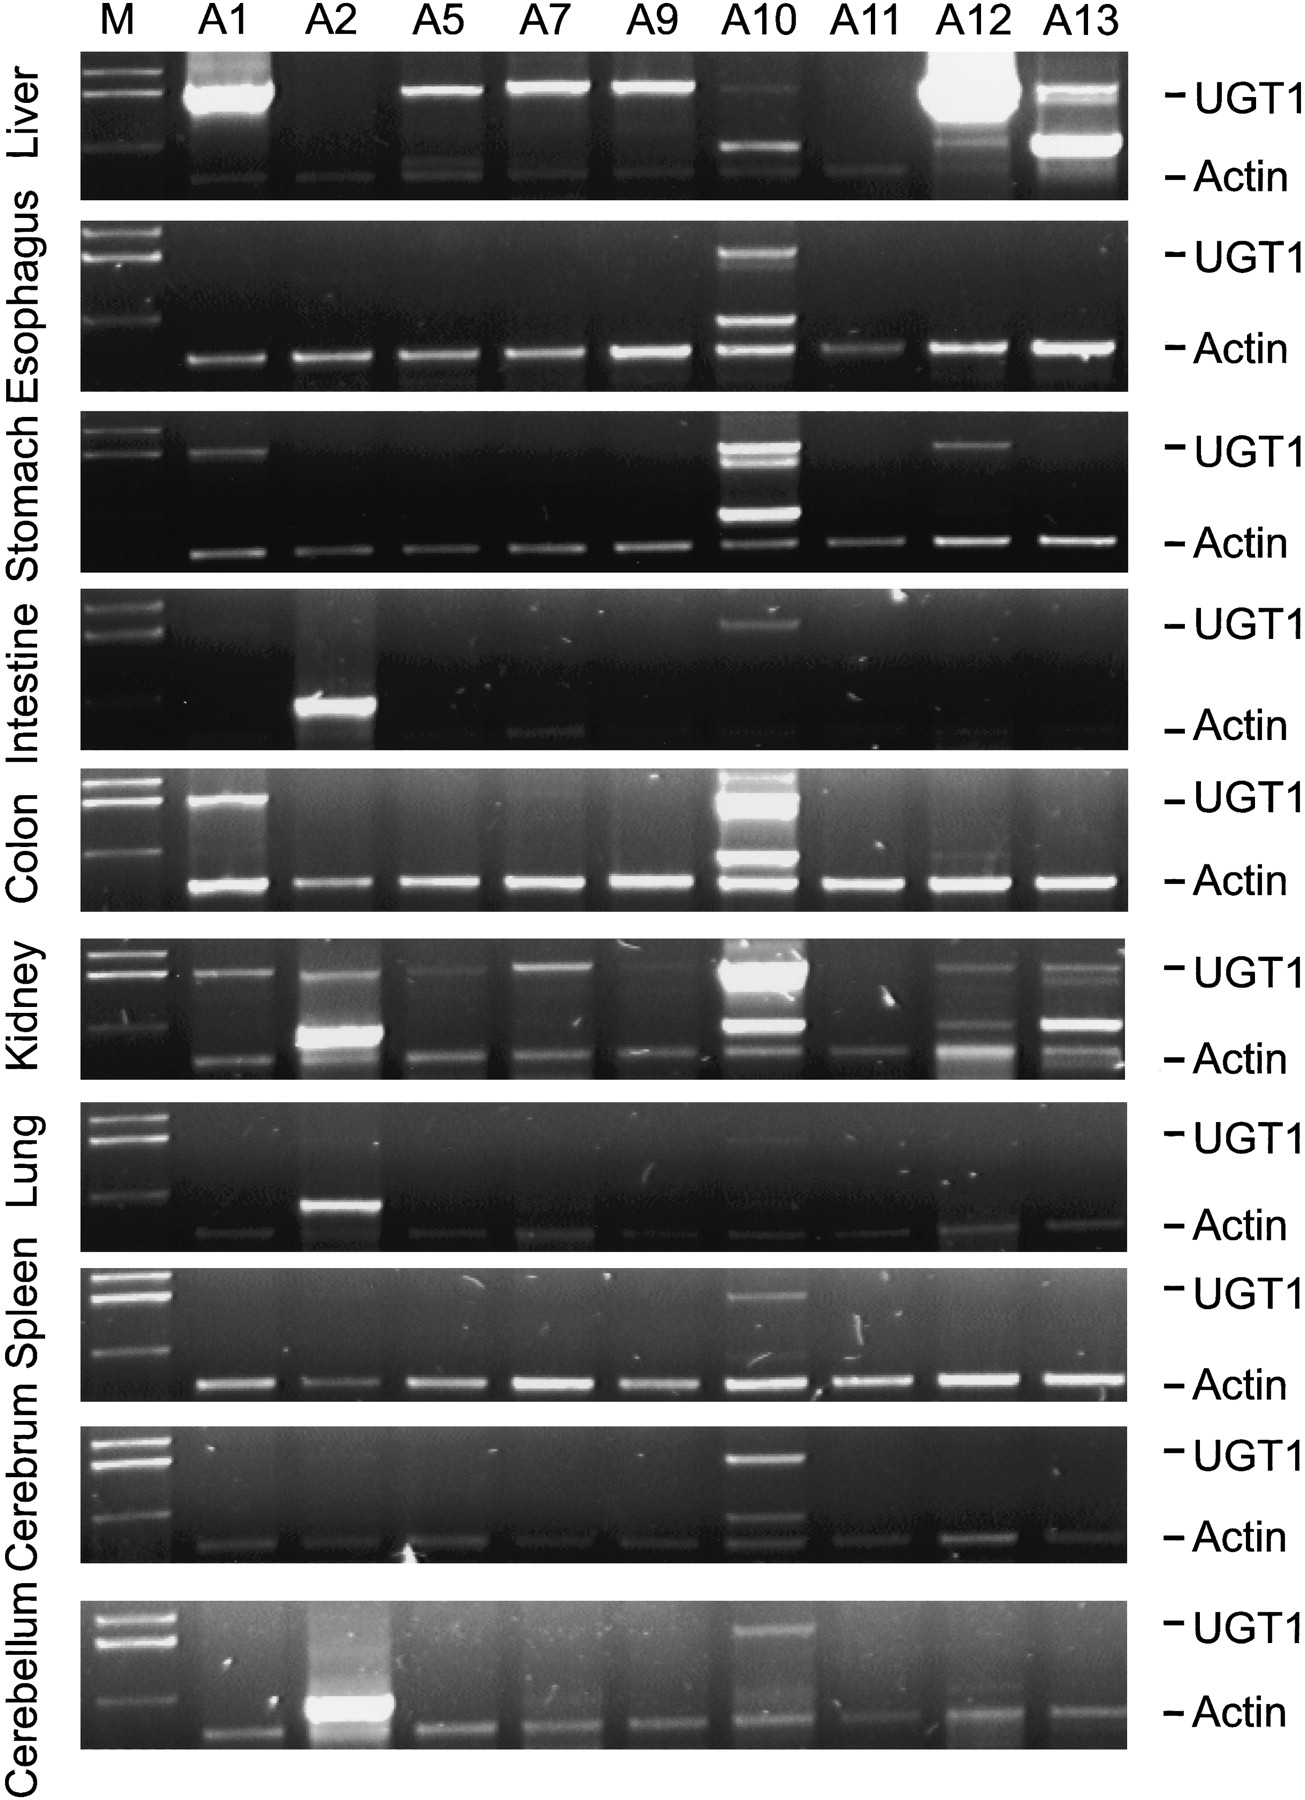
Figure 2
Tissue-specific expression profiles of mouse UGT1 gene cluster. The expression of UGT1 was assessed by DRT-PCR using primers specific for each isoform. We used an actin primer pair as an internal control. The tissue sources are shown on the left of each panel. The amplified cDNA products are indicated on the right of each panel. The band slightly above the actin cDNA is a nonspecific PCR product. The UGT1 isoforms are indicated above each lane. (M) Marker.


