
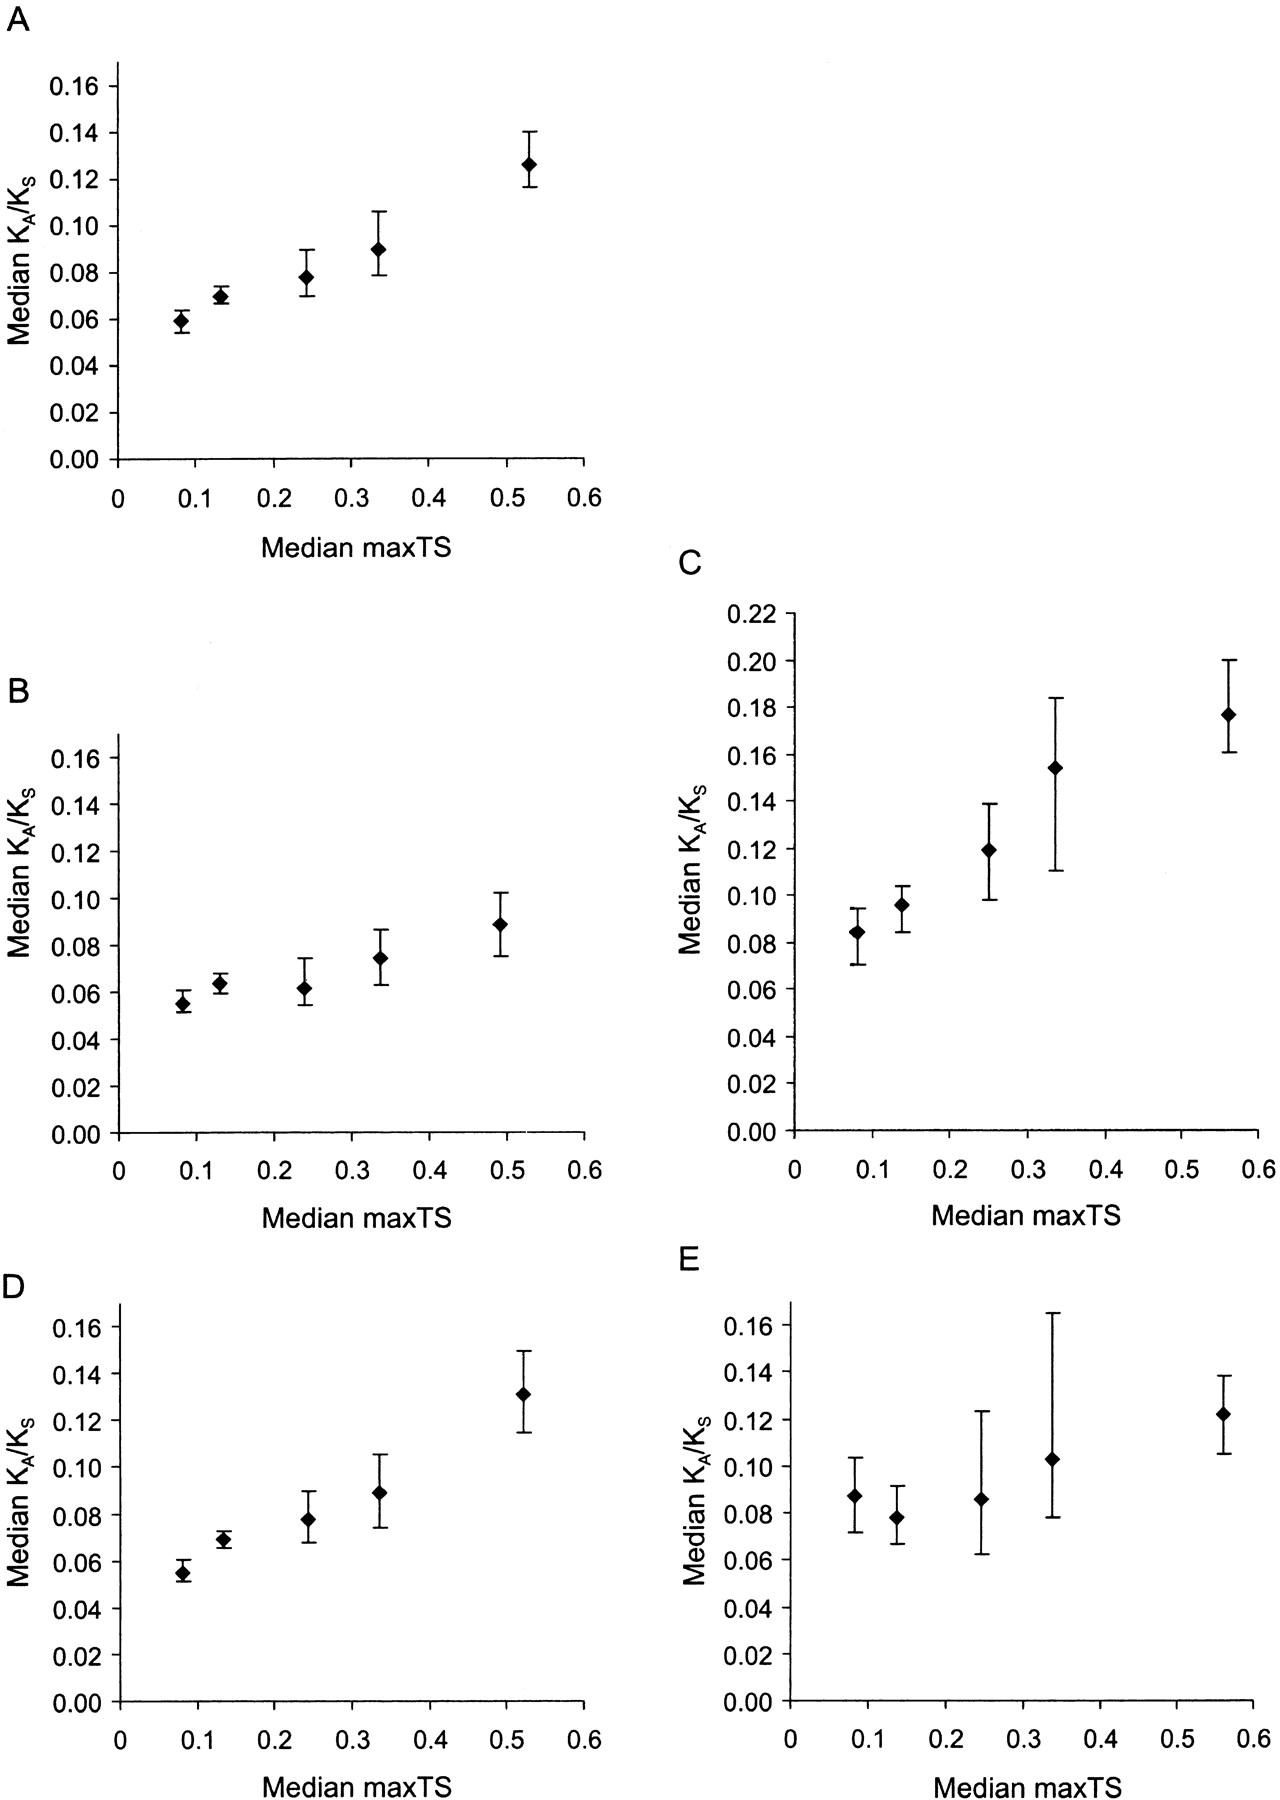
Variation of the evolutionary rate (KA/KS) with maximum tissue specificity (maxTS) across five partitions. (A) All genes. (B) Genes whose products lack a detectable signal peptide. (C) Genes whose products contain a signal peptide, and are thus likely to be secreted. (D) Genes not known to be associated with human disease. (E) Disease genes. Error bars represent the 95% confidence interval for the median (as implemented by MINITAB, http://www.minitab.com). Regression formulae for partitions 1 to 5 are: y = 0.0467 + 0.143x; y = 0.0492 + 0.0773x; y = 0.0711 + 0.200x; y = 0.0415 + 0.163x; and, y = 0.0715 + 0.0869x, respectively, where y = median KA/KS and x = median maxTS. The probabilities (P-values) that equivalent partitions for secreted and nonsecreted gene products differ are as follows: partitions 1: P = 3 × 10⁻⁵; partitions 2: P = 4.25 × 10⁻¹¹; partitions 3: P = 3.5 × 10⁻⁷; partitions 4: P = 4.8 × 10⁻⁶; and partitions 5: P = 8.8 × 10⁻¹³; and, P-values for disease and nondisease genes: partitions 1: P = 1.0 × 10⁻⁴; partitions 2: P = 0.14; partitions 3: P = 0.67; partitions 4: P = 0.10; and partitions 5: P = 0.21.


