
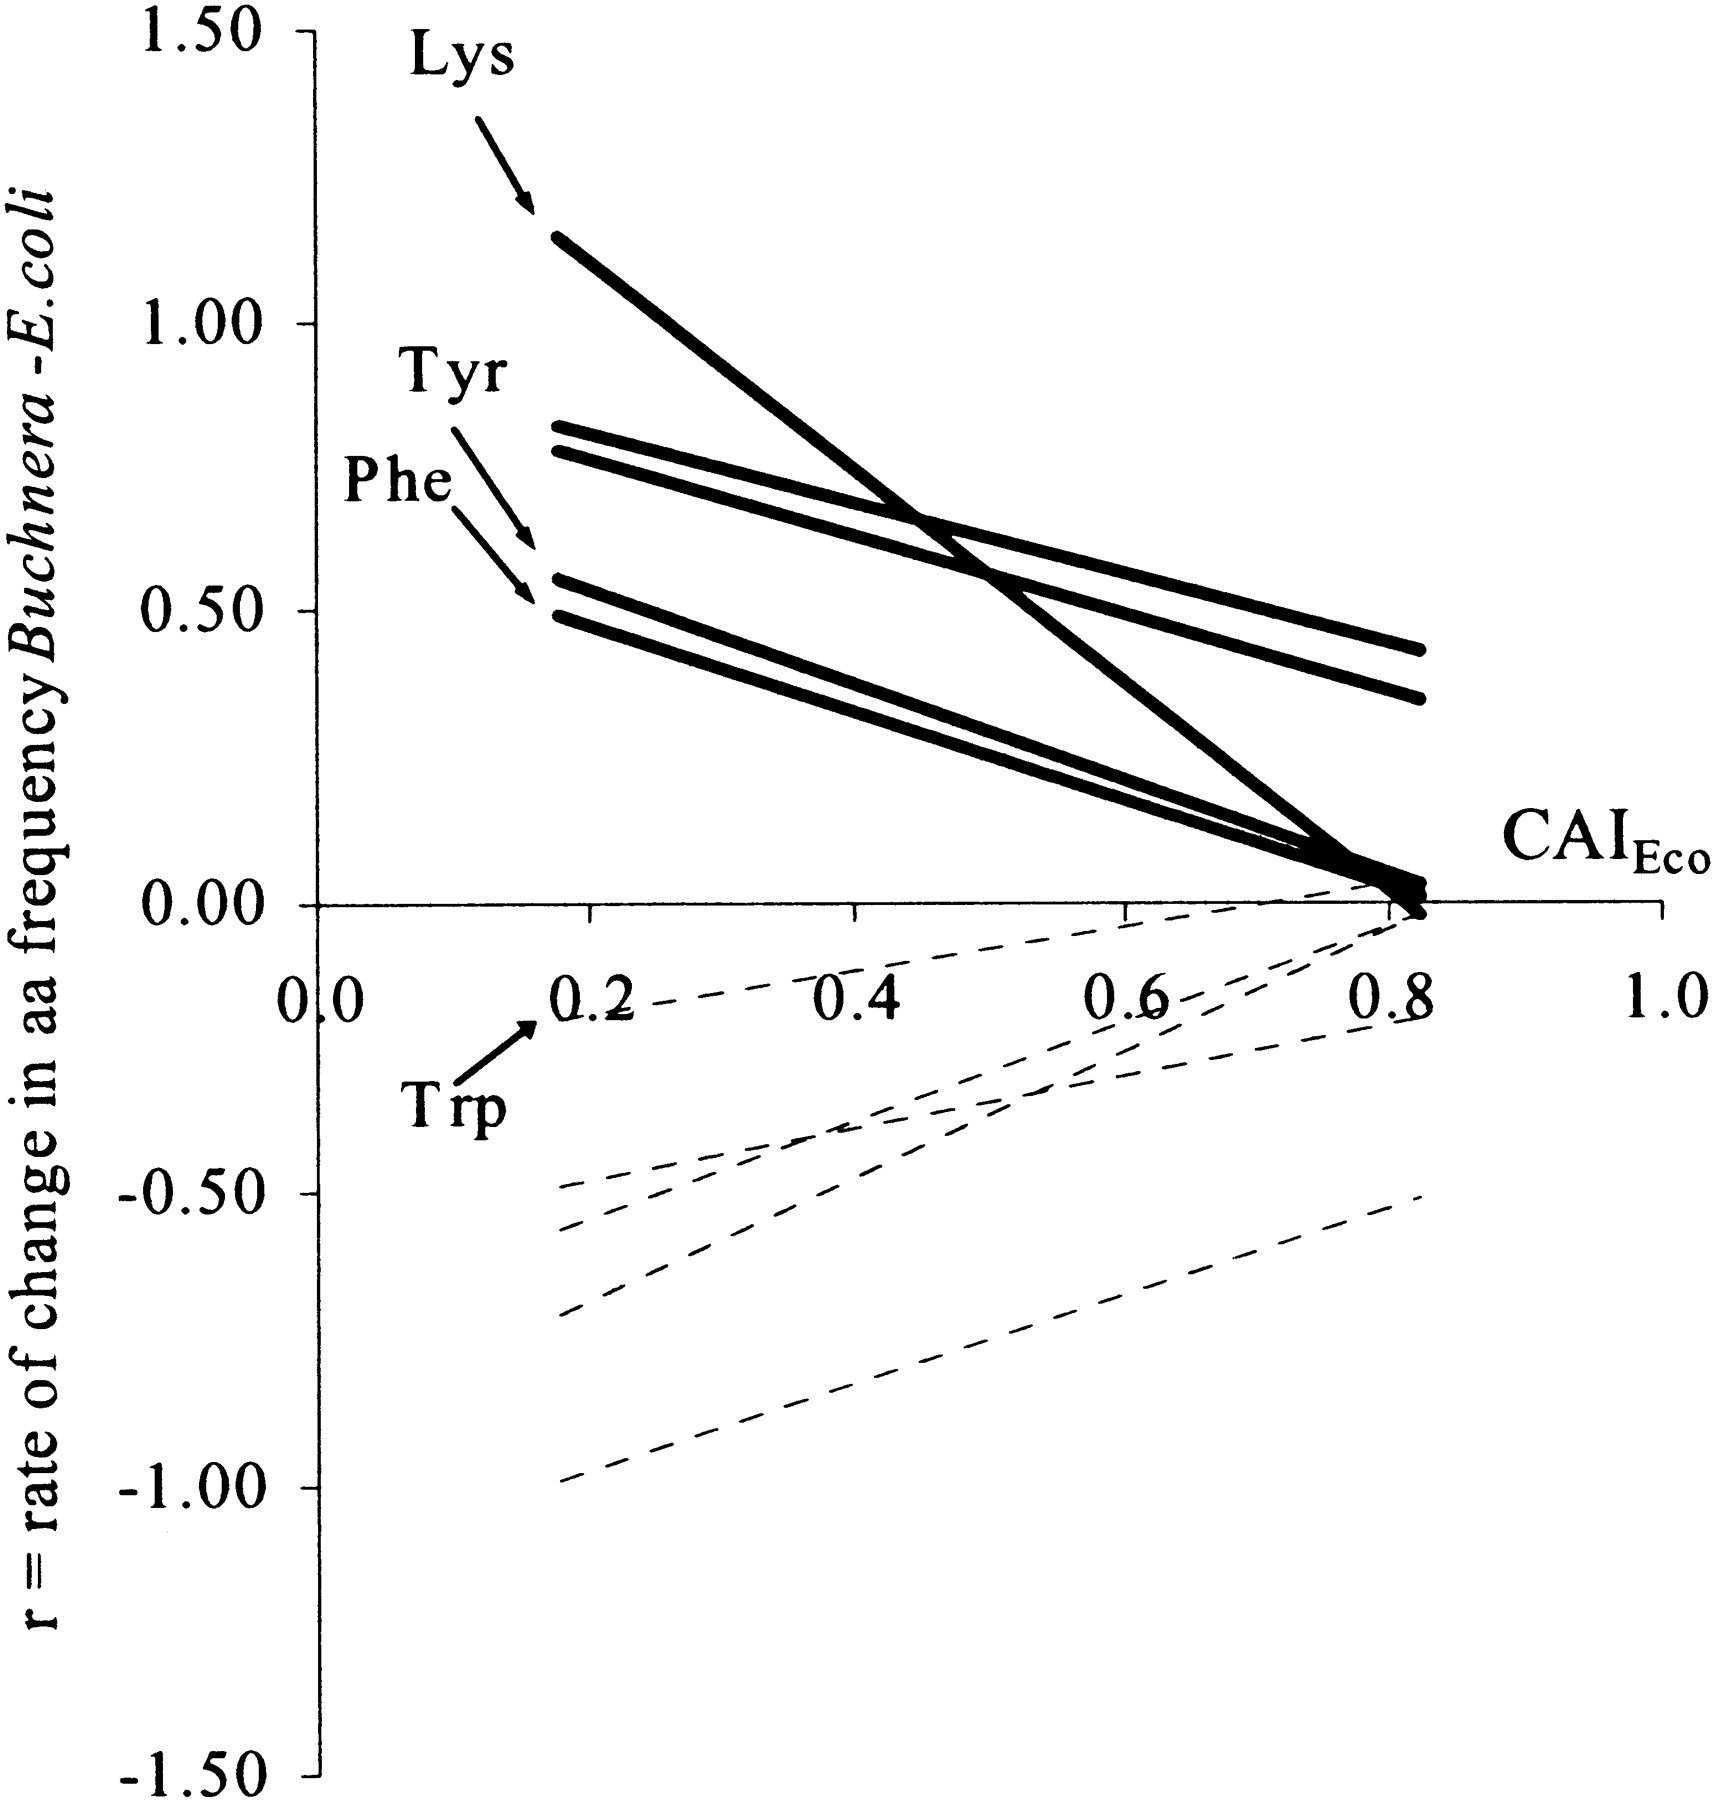
Figure 3
Relative change in amino acid frequency (r) between Buchnera-Sgr genes and their E. coli orthologs, in relation to the CAI in E coli. Solid lines, residues with AT-rich codons (at least 2 A or Ts); dotted lines, residues with GC-rich codons (at least 2 G or Cs; formula of r in equation 1).


