
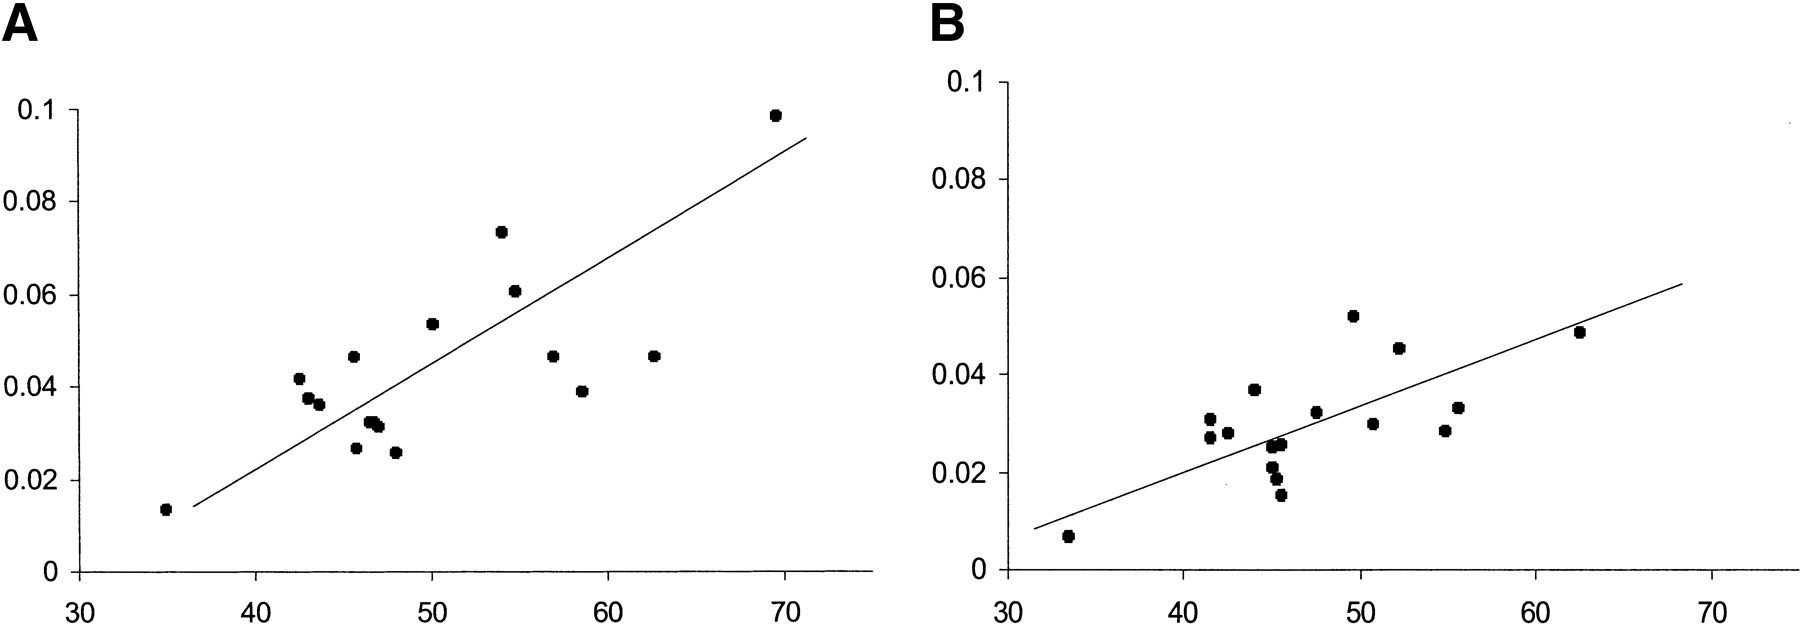
Figure 2
Relationship between the rate of nucleotide substitution (estimated by the Tamura-Nei method, Y-axis) and the GC content (%, X-axis) of intron sequences. (A) The entire sequence of each segment was used. Pearson's correlation coefficient is 0.76 (p < 0.01). (B) CpG dinucleotides were excluded. Pearson's correlation coefficient is 0.67 (p < 0.01).


