
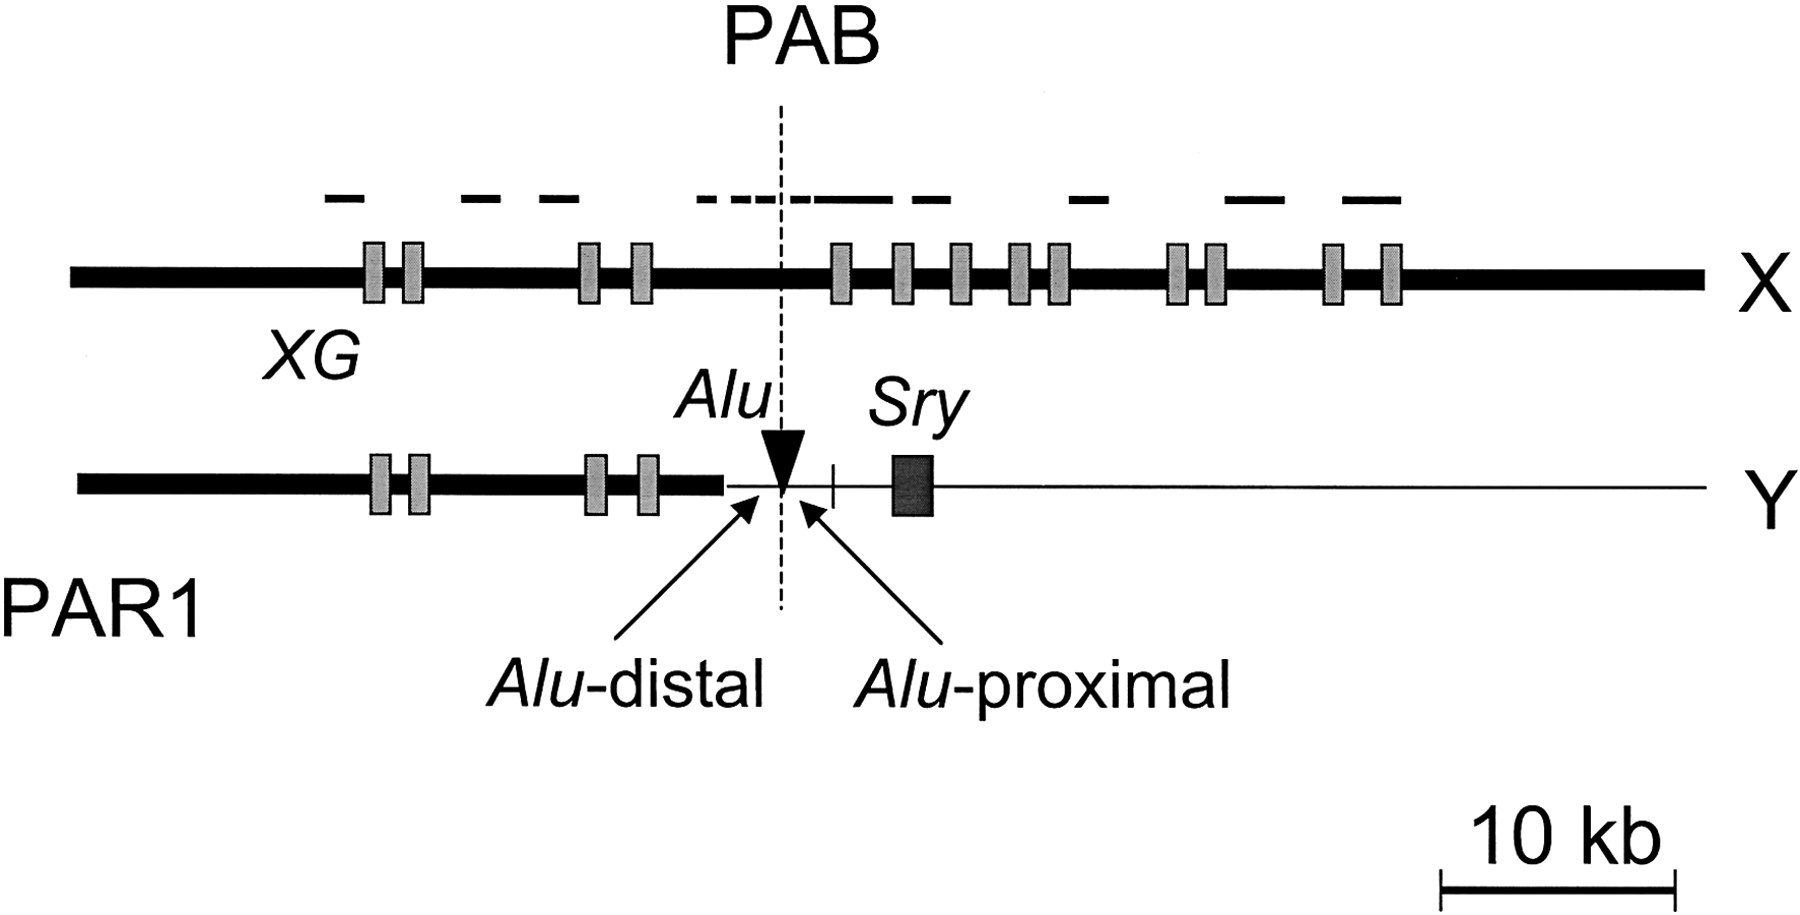
Figure 1
Schematic diagram of the XG regions. Filled boxes indicate the exons of the XG gene as identified in Ellis et al. (1994). The regions of the XG gene sequenced in this study are shown as lines above the diagram. Thick bars represent the sequences on or homologous to the X-chromosome. On the Y-chromosome, the Alu insertion site that separates the pseudoautosomal boundary is indicated. Alu-distal and Alu-proximal regions are not drawn to scale; their actual sizes are 234 bp and 221 bp, respectively.


