

Figure 4
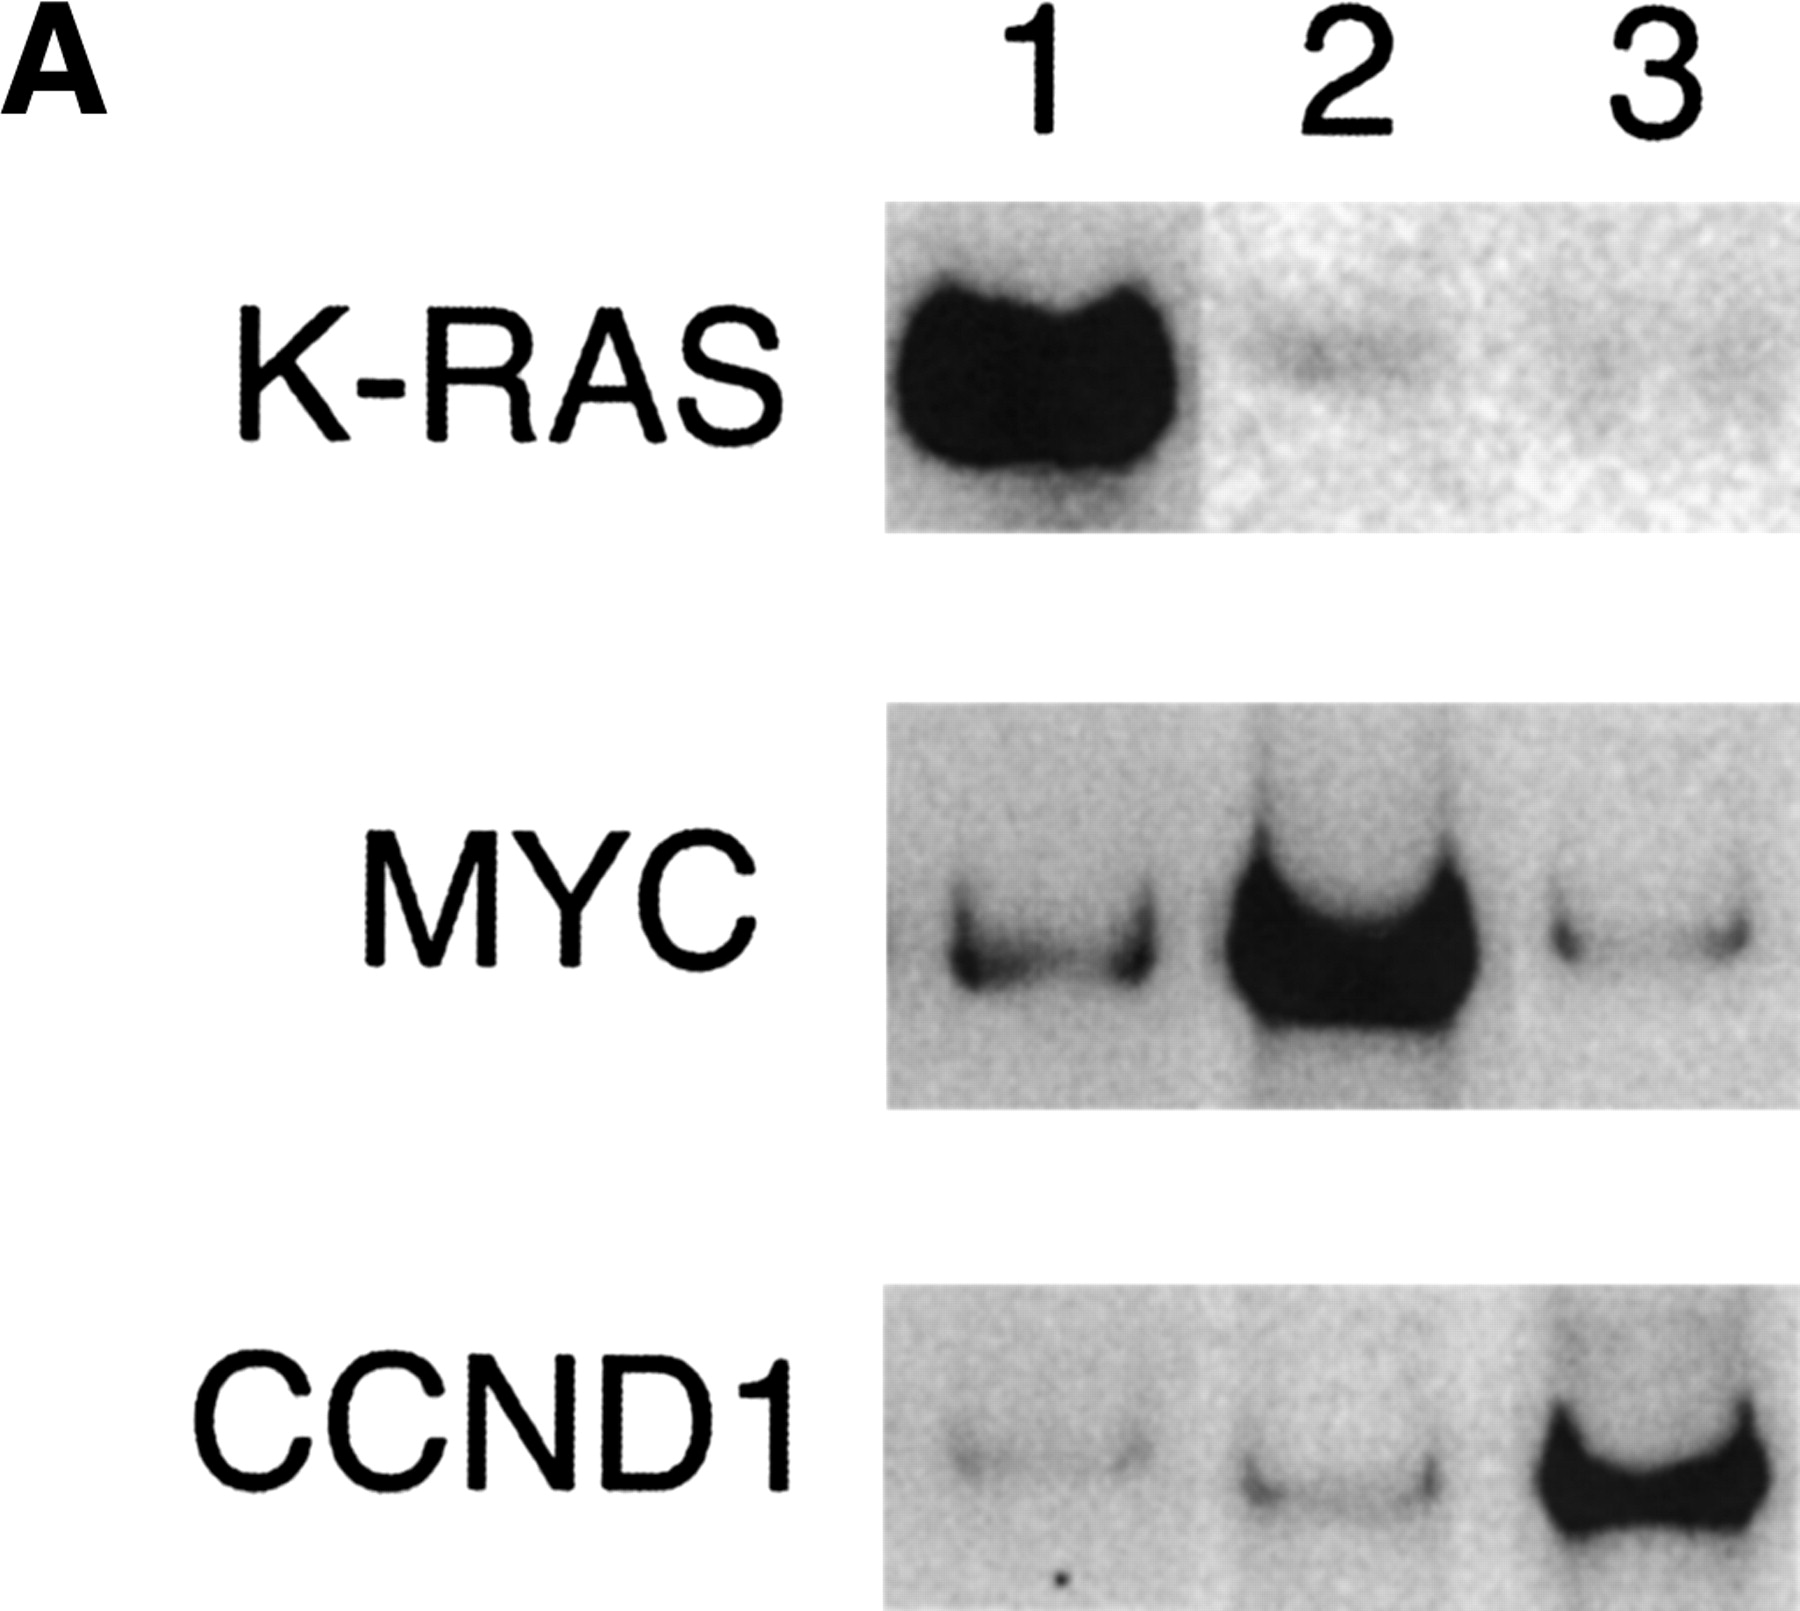
Array CGH analysis of oncogene amplifications in mouse mammary tumors. (A) Southern analysis of tumor DNA using Kras2, Myc, and Ccnd1 specific probes. Tumors 1, 2, and 3 showed amplification of Kras2, Myc, and Ccnd1, respectively. (B) Whole-genome array CGH profiles (left panels) and CGH profiles of the relevant chromosomes (right panels) from mouse mammary tumors 1, 2, and 3. Plotted are log2-transformed hybridization ratios of tumor DNA vs. control DNA. Vertical red bars on each chromosome indicate the positions of Kras2, Myc, and Ccnd1, respectively.


