
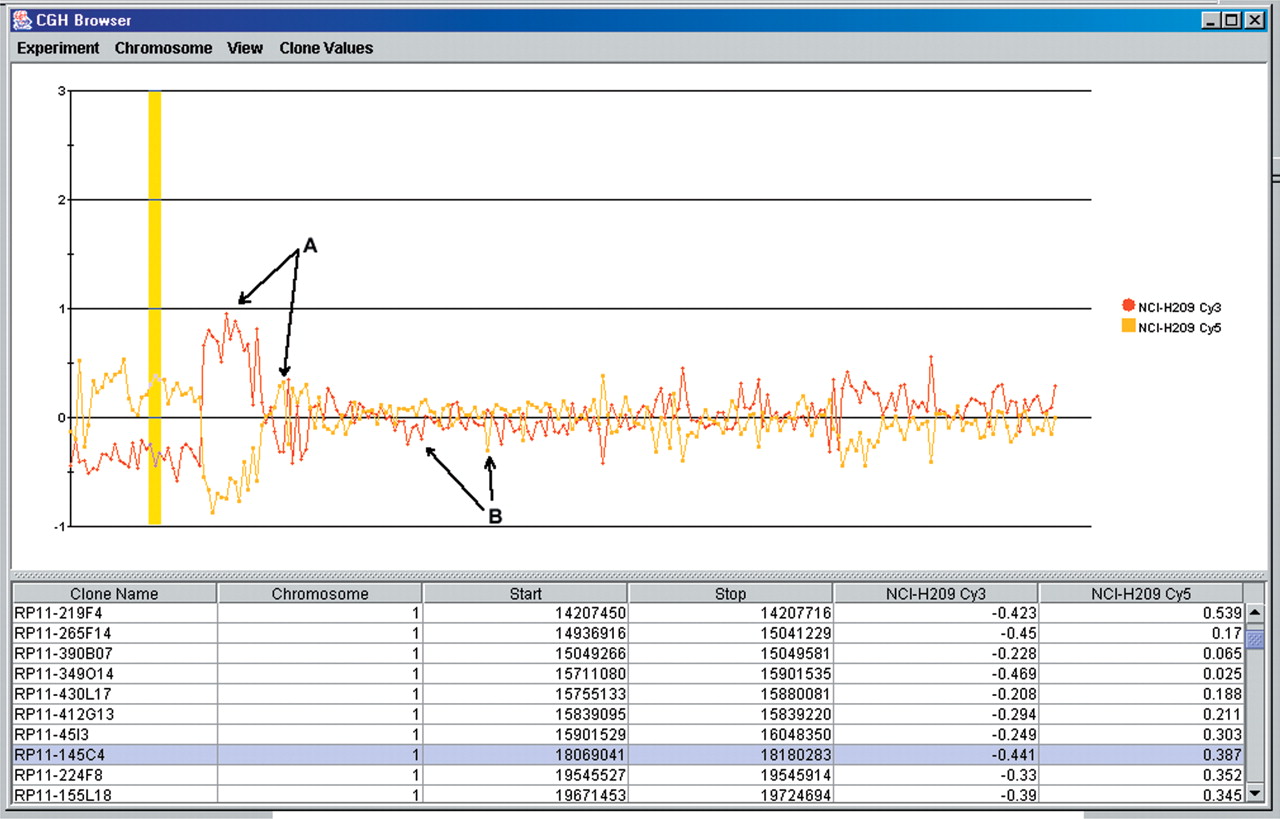
CGHBrowser screen shot depicting a chromosome 1p deletion flanked by a copy number increase in the lung cancer cell line NCI-H209. This view can be used to access raw data and estimate the amplitude of copy number changes. Scores from any spot-calling algorithm and Cy3/Cy5 ratios in a log2 and linear scale can also be visualized. The abscissa can be set to display data scaled to genome coordinates or in linear order (shown here). Intensity ratios with tumor DNA labeled with Cy3-dCTP are red; the same DNA labeled with Cy5-dCTP is represented in yellow. Ratios above or below the threshold for normal variation that represent true copy number gain or loss should have a dye-swap match of equal magnitude above or below y = 1 or y = -1, respectively (arrow A). Clones not conforming to this pattern consistently in normal:normal cohybridizations were eliminated from the set (arrow B).


