
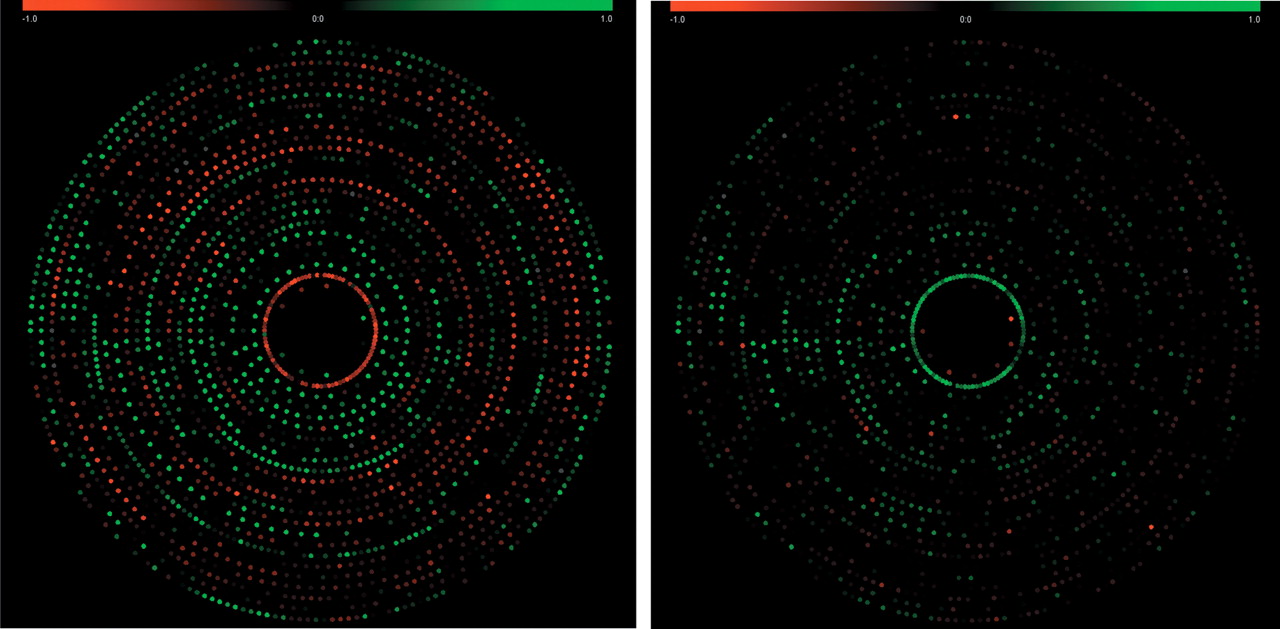
Figure 4
CircleViewer screen shots summarizing data from two cancer cell lines (NB13, left; PA1, right). The concentric circles represent chromosomes in order of size, and each spot represents a BAC clone. Gains (green) and losses (red) are derived from intensity ratios above or below an adjustable threshold (here, deletion ≤ 0.8, gains ≥). BAC clones can be identified and raw data accessed interactively.


