
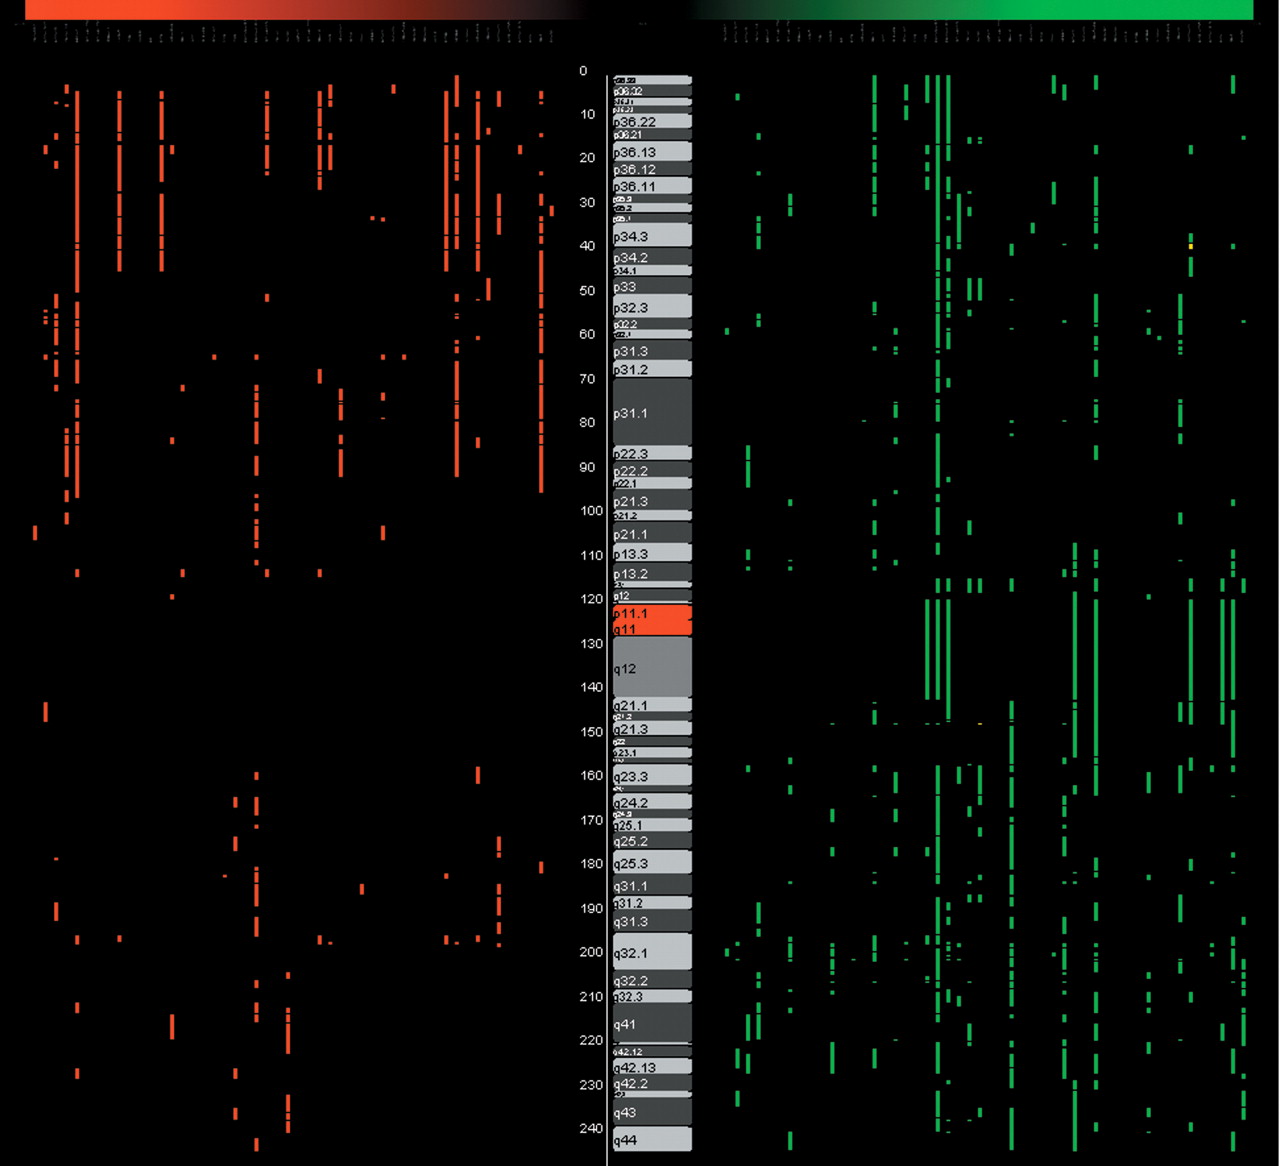
Figure 3
Cancer cell line dye-swap experiments loaded into the CGHAnalyzer main window (chromosome 1). Columns depict the copy number profile of each cell line with respect to its genome position on chromosome 2. Copy number gains are shown in green, losses are shown in red. Selecting a clone or region gives access to these data and the raw data in another window.


