
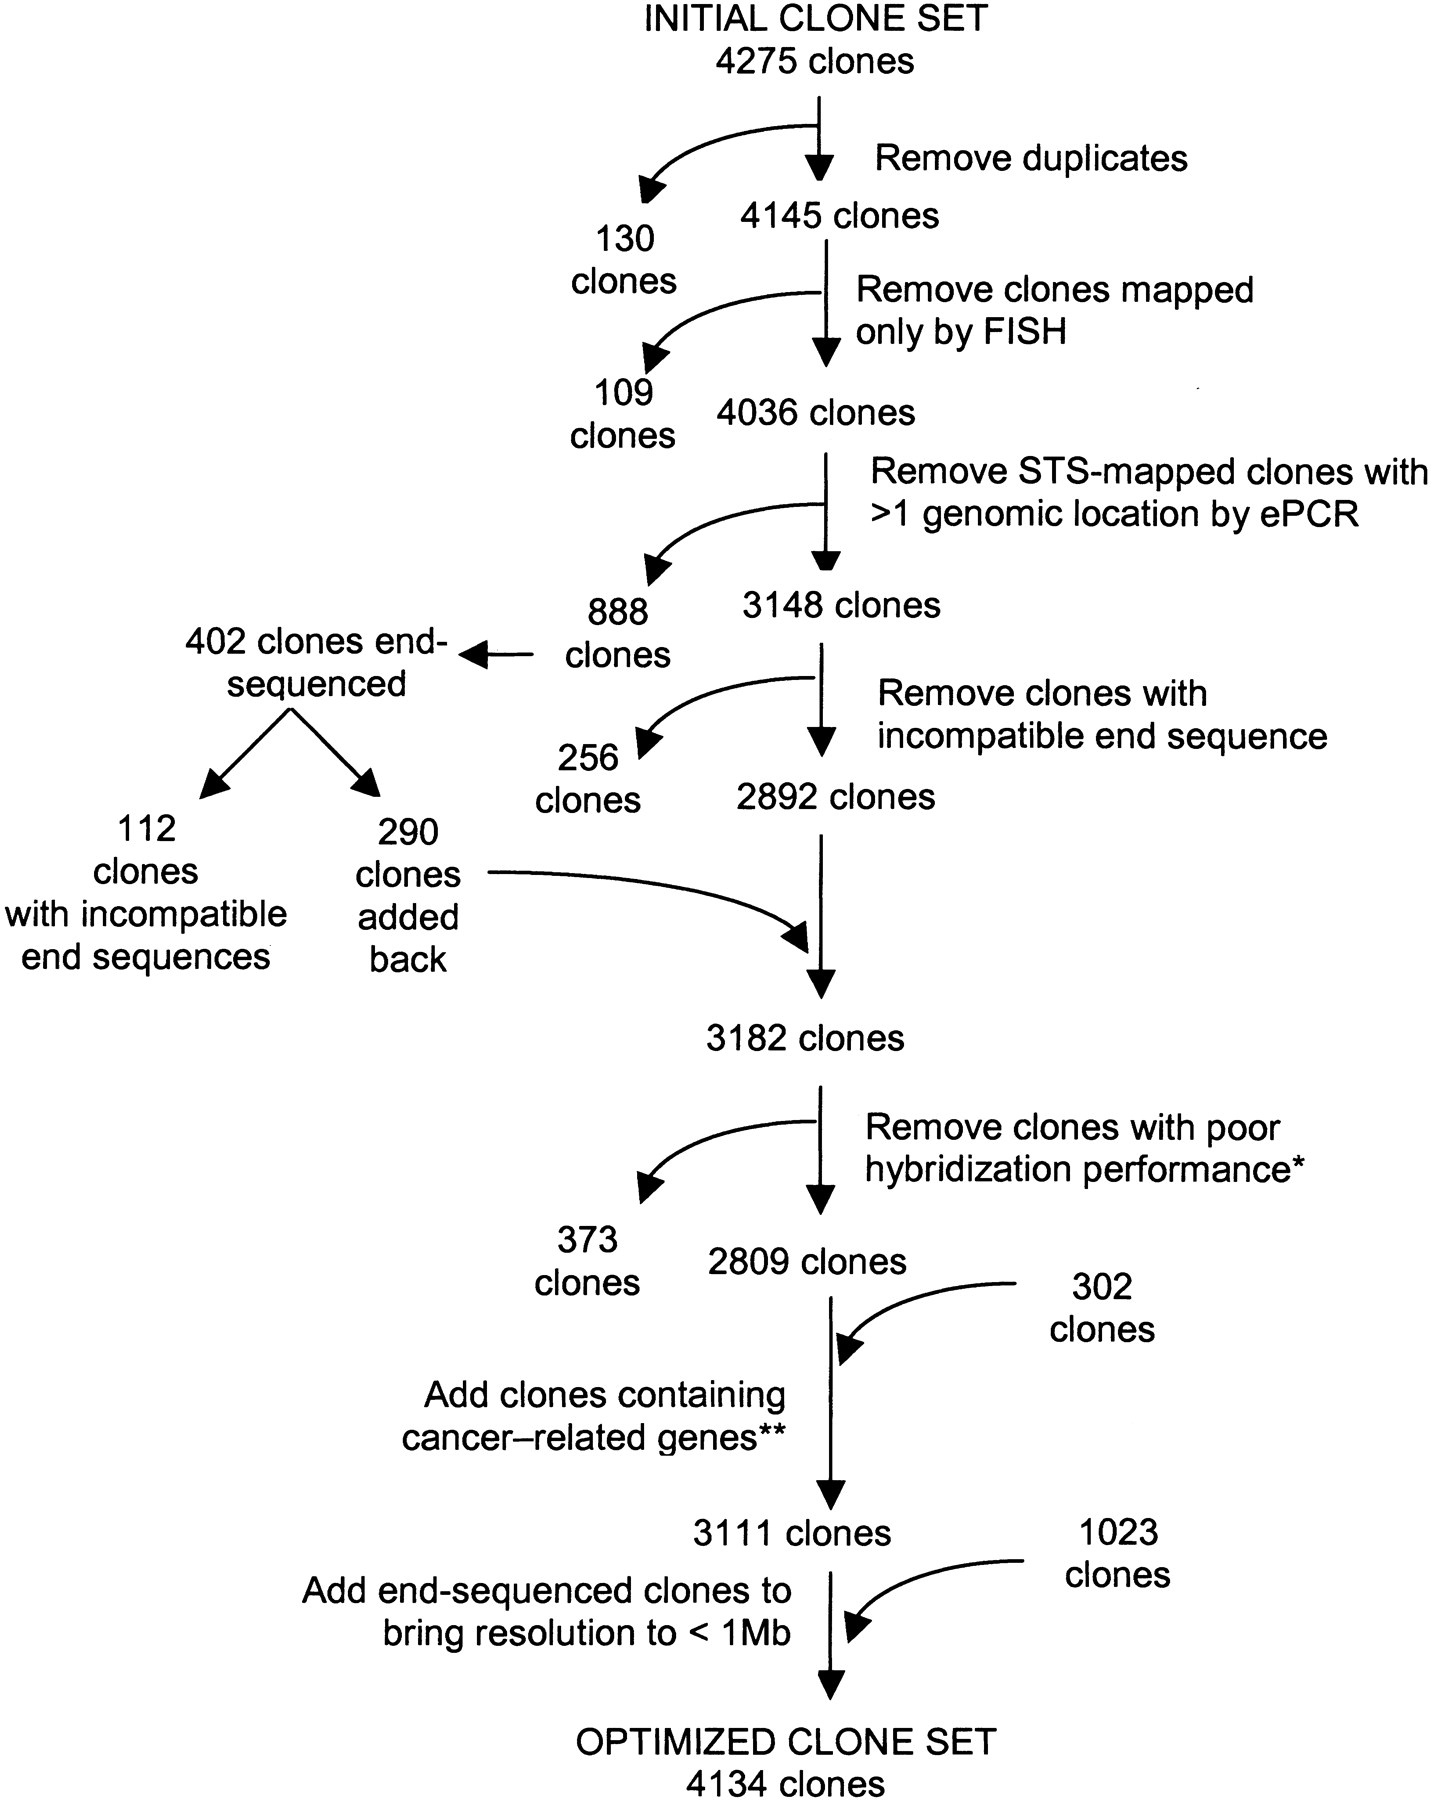
Figure 1
Flow chart describing the optimization process and the number of clones removed or added at each step. *Poor hybridization performance is defined in the text. **A list of the cancer-related genes can be found in the Supplemental data.


