
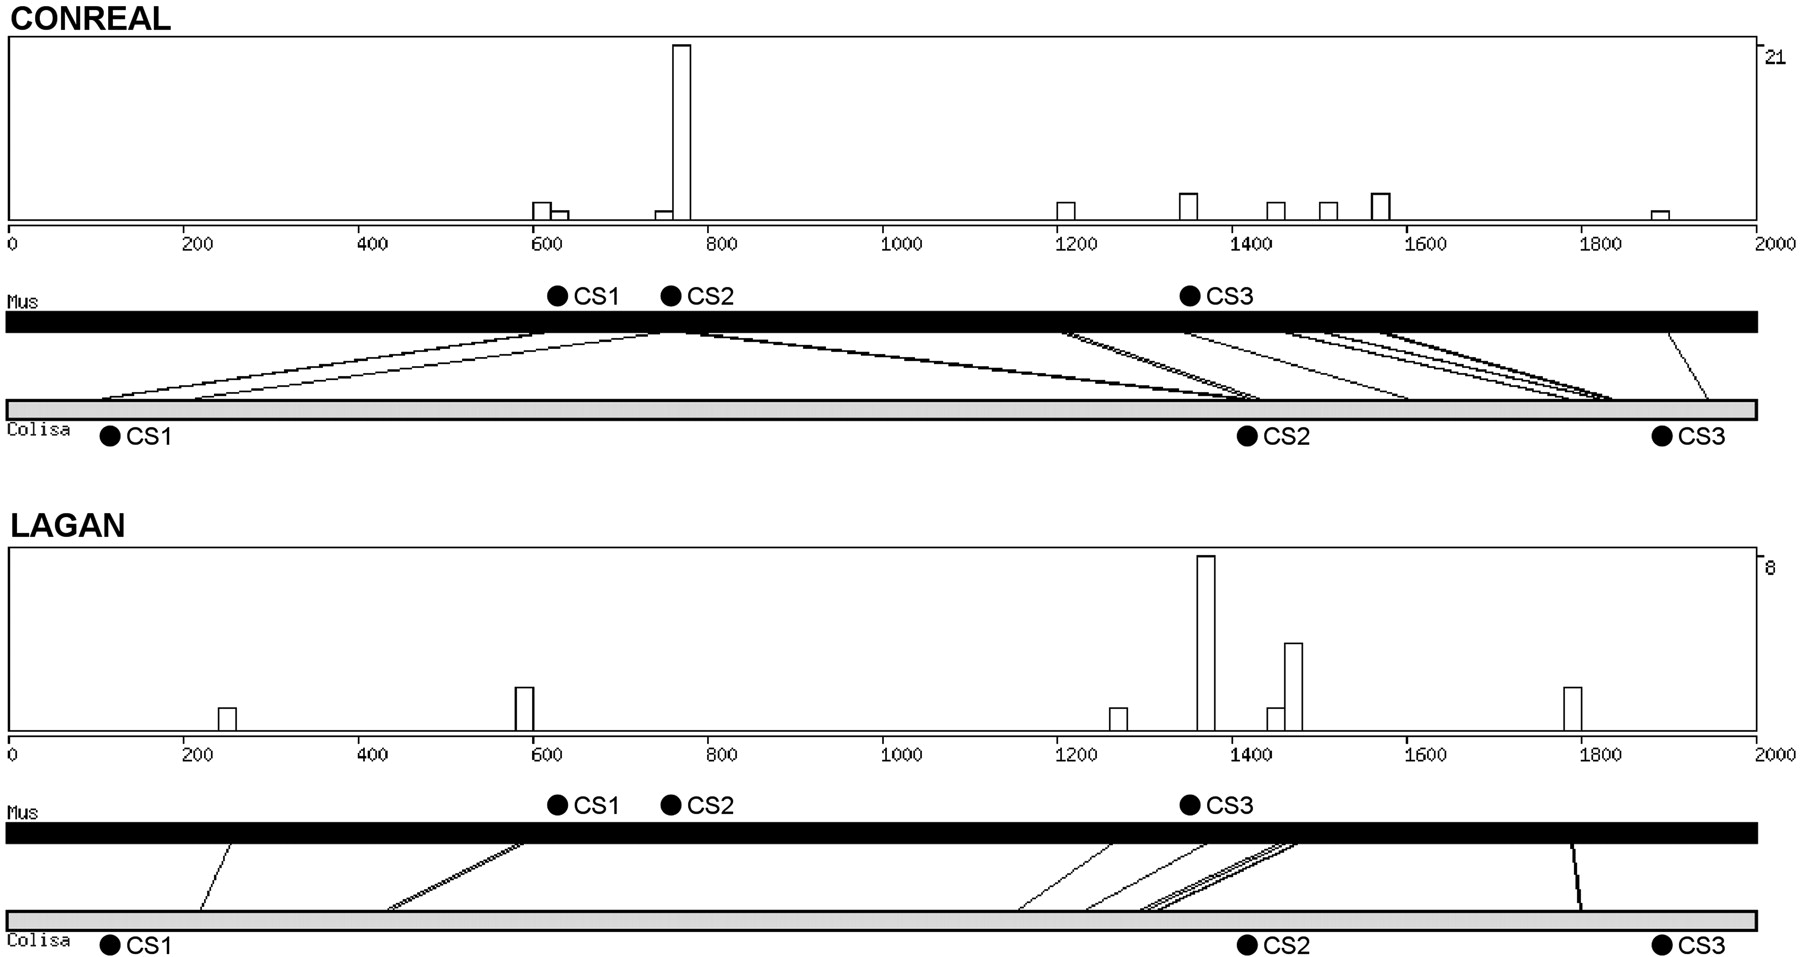
Output of the CONREAL webinterface. The example shows the results for the analysis of the mouse and dwarf gourami Foxa2 promoter regions (Accession nos. AB050942 and AB050940, respectively) performed by CONREAL (top) and LAGAN methods (bottom). The graphs show the positions of aligned hits and the distribution/concentration of conserved TFBSs along the sequences. The graphs are followed by sequence-alignment data and tables of conserved TFBSs linked to TransFac entries (data not shown). Black circles above the black bar (mouse sequence) and below the gray bar (gourami sequence) represent positions of the conserved regulatory elements CS1–CS3 that are experimentally confirmed to be functional in mouse and gourami sequences. The analysis parameters are 80% PWM threshold, 50% homology threshold, and 15-bp flank length.


