
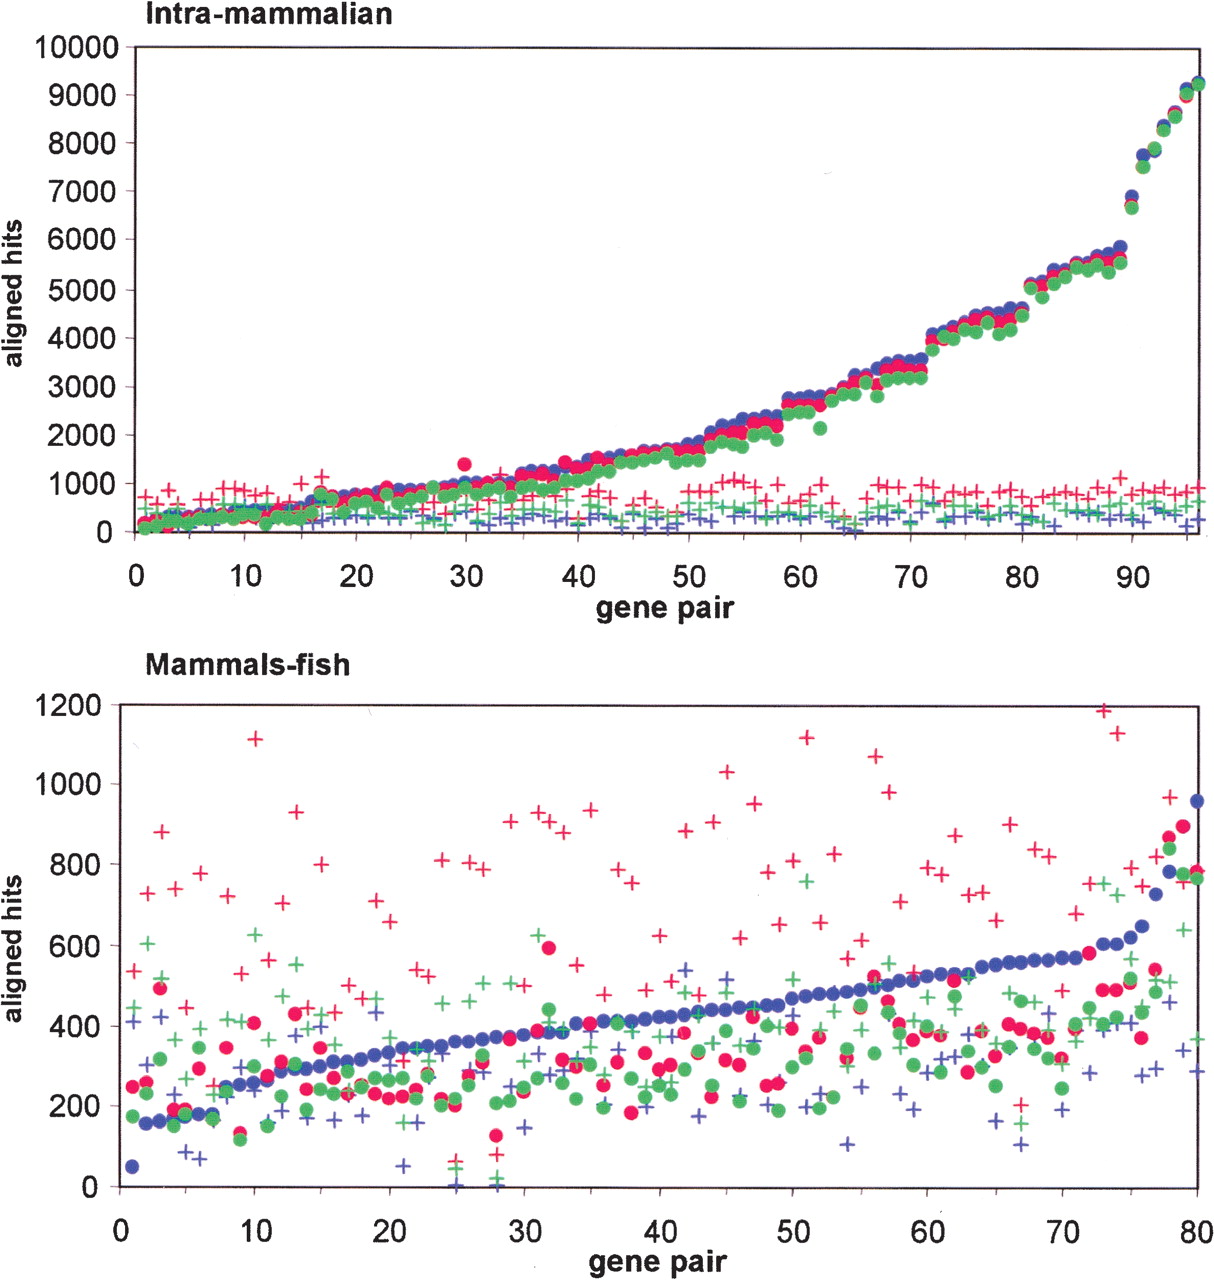
Figure 4
Estimation of spurious prediction levels in intramammalian (top) and mammals–fish (bottom) pairwise comparisons. Dots represent total number of aligned hits found in an orthologous pair, whereas crosses represent the number of aligned hits found in the same pair when orthologous sequences are randomized. AVID results are shown in green, LAGAN in red, and CONREAL in blue. The data sets are sorted by the number of CONREAL predictions to improve perception of the graph. The analysis parameters are 75% PWM threshold, 50% homology threshold, and 5-bp flank length.


