
Figure 1
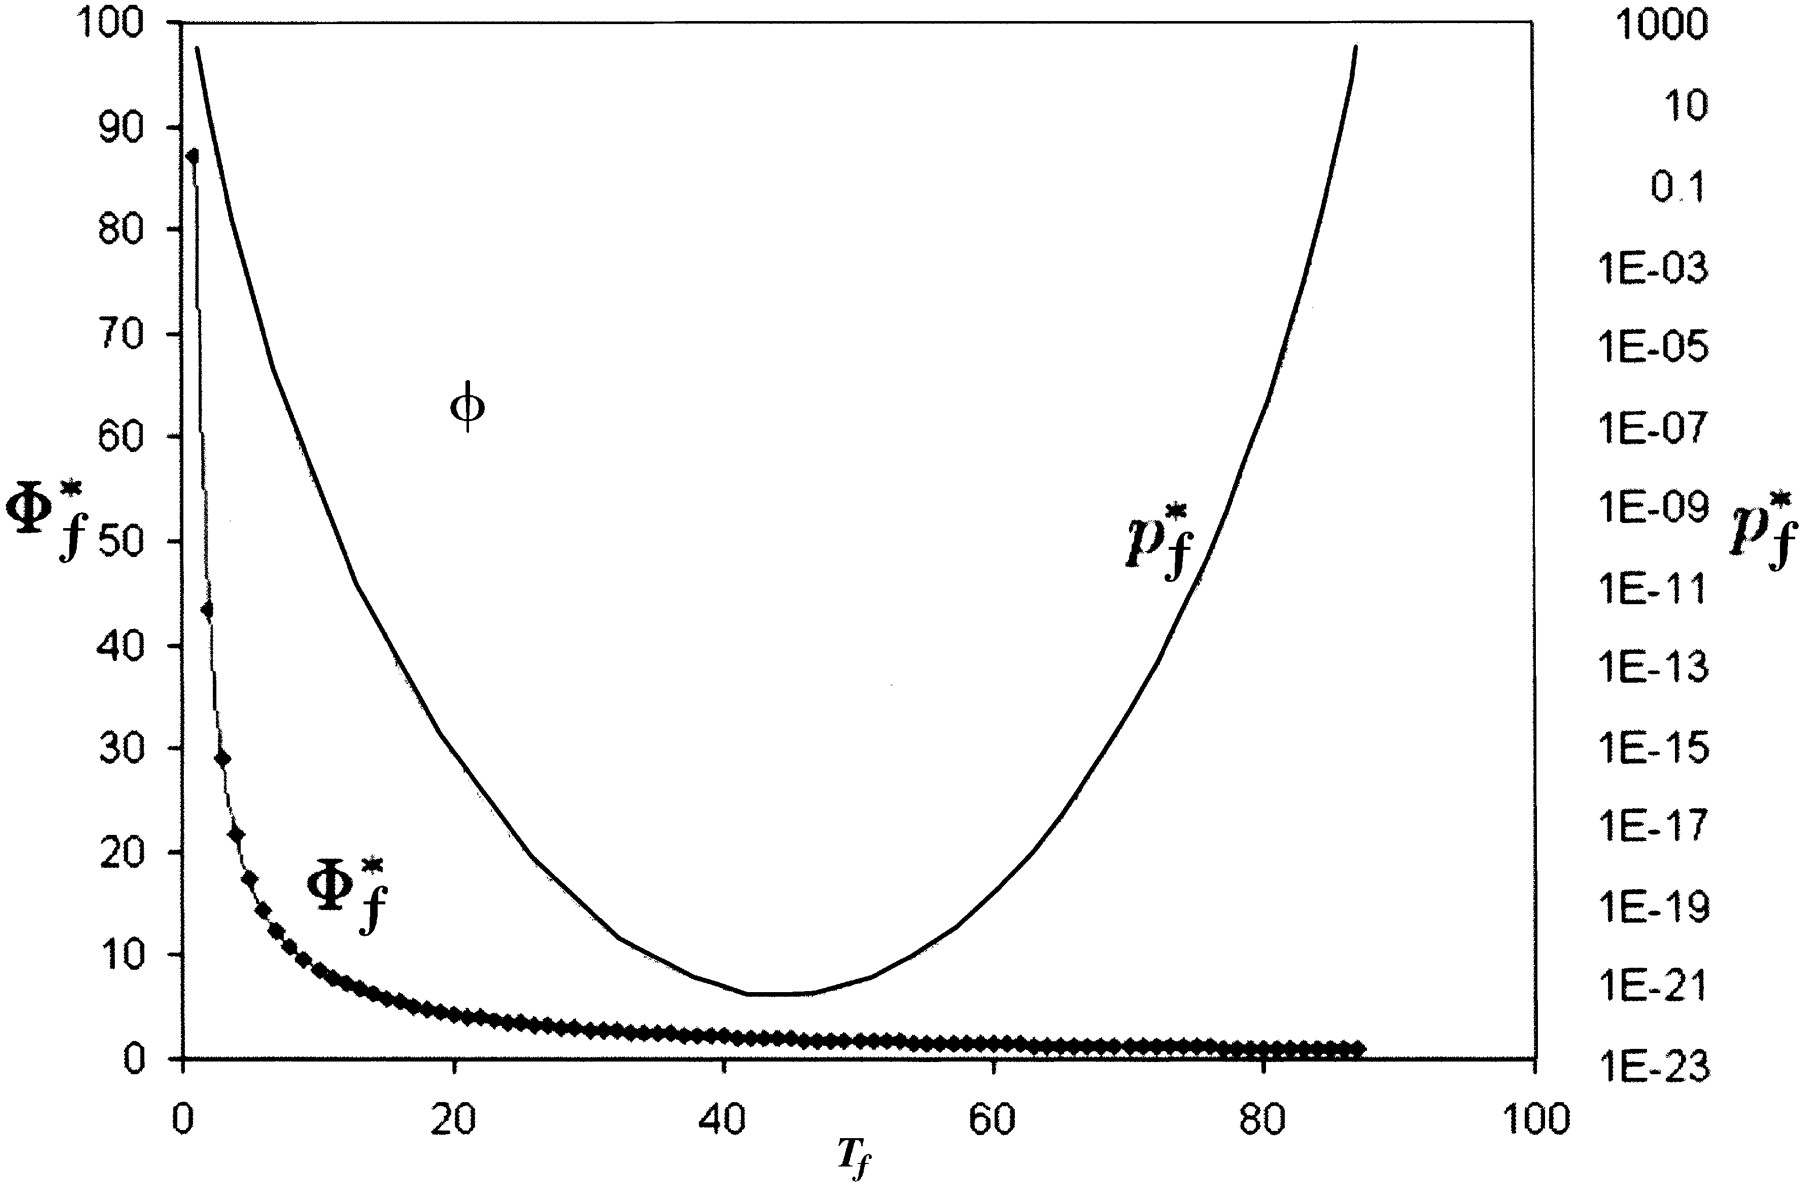
Relationship between maximum propensity Φ and minimum estimated  as a function of the number of organisms exhibiting phenotype f, given that there are N = 86 total genomes and that we are testing X = 4000 genes.


