
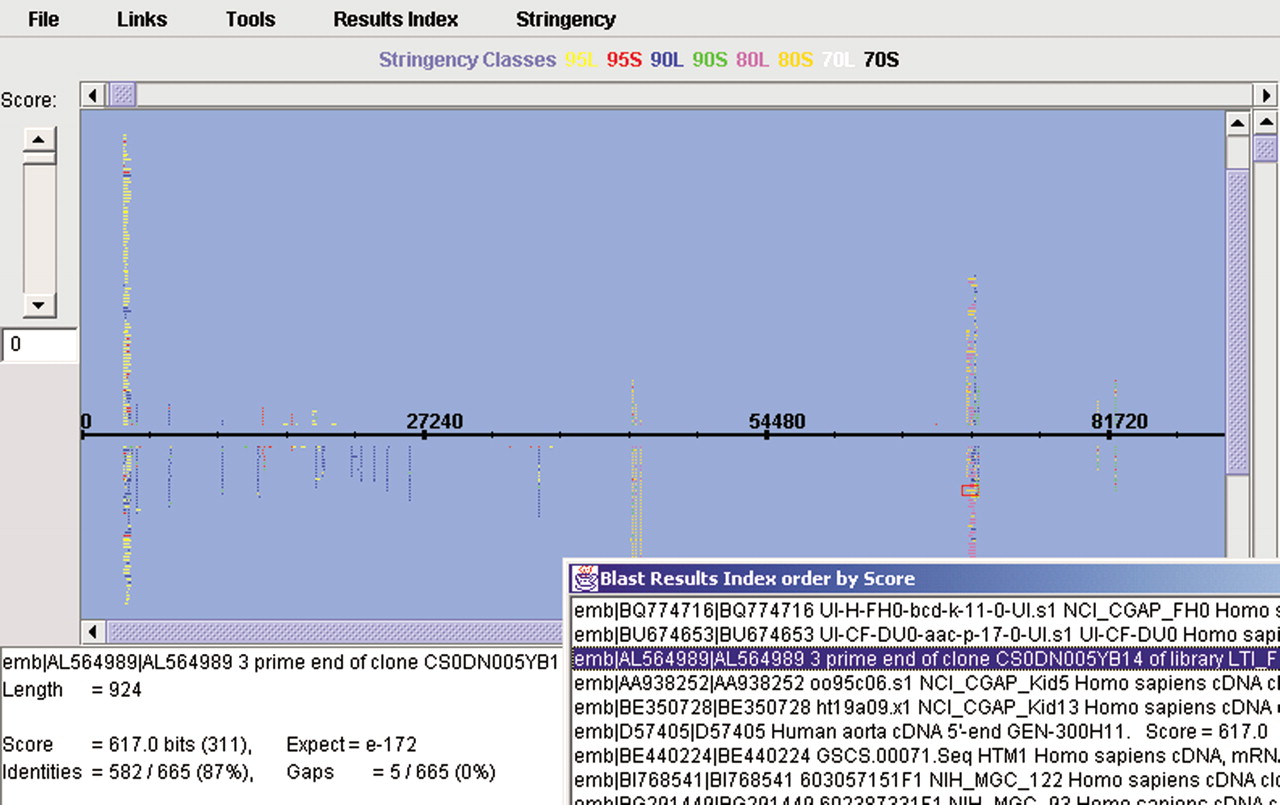
Figure 5
BLAST Display. The BLAST Display shows a summary of all the BLAST hits. The display can be scrolled and zoomed. An index of all of the hits can be displayed optionally—as shown—which is linked to the main display. The slider on the left of the display is used to screen the BLAST hits on minimum score value. Window images are clipped for presentation purposes.


