
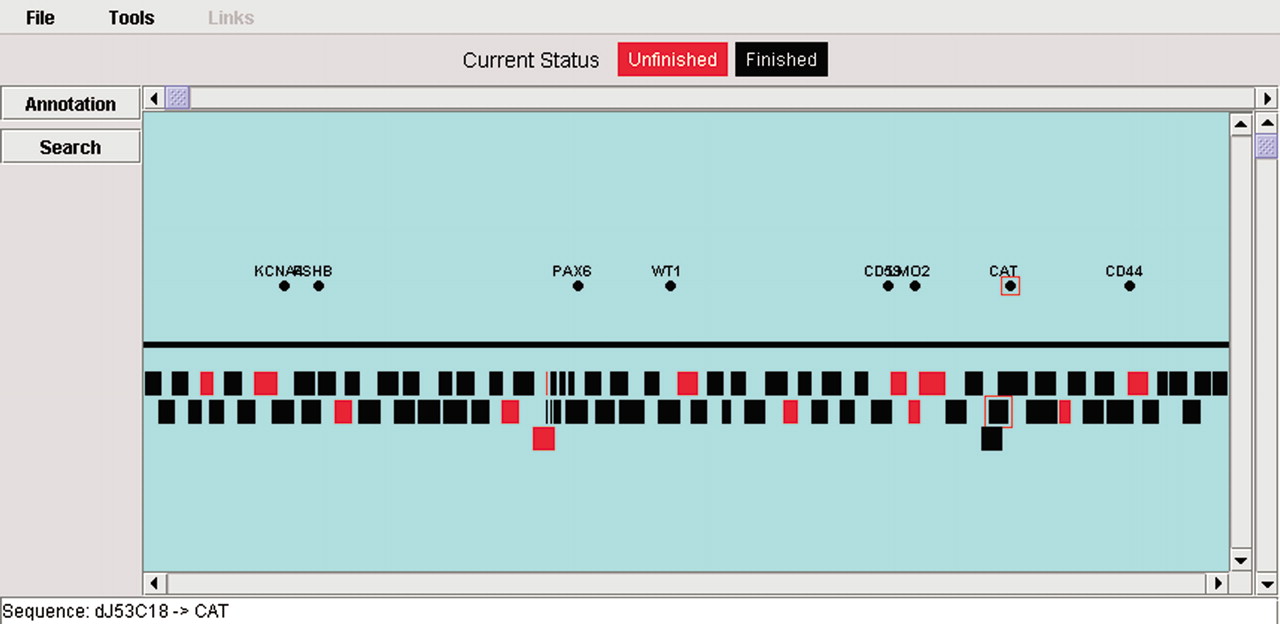
Figure 3
Contig display. The initial display shows the minimal tiling path for the region (in this case the chromosome 11 WAGR region) with markers above to assist in navigation. The markers are linked to the associated sequence clones and vice versa. The display can be zoomed in and out. From it, the Annotation Display can be launched. Window image is clipped for presentation purposes.


