
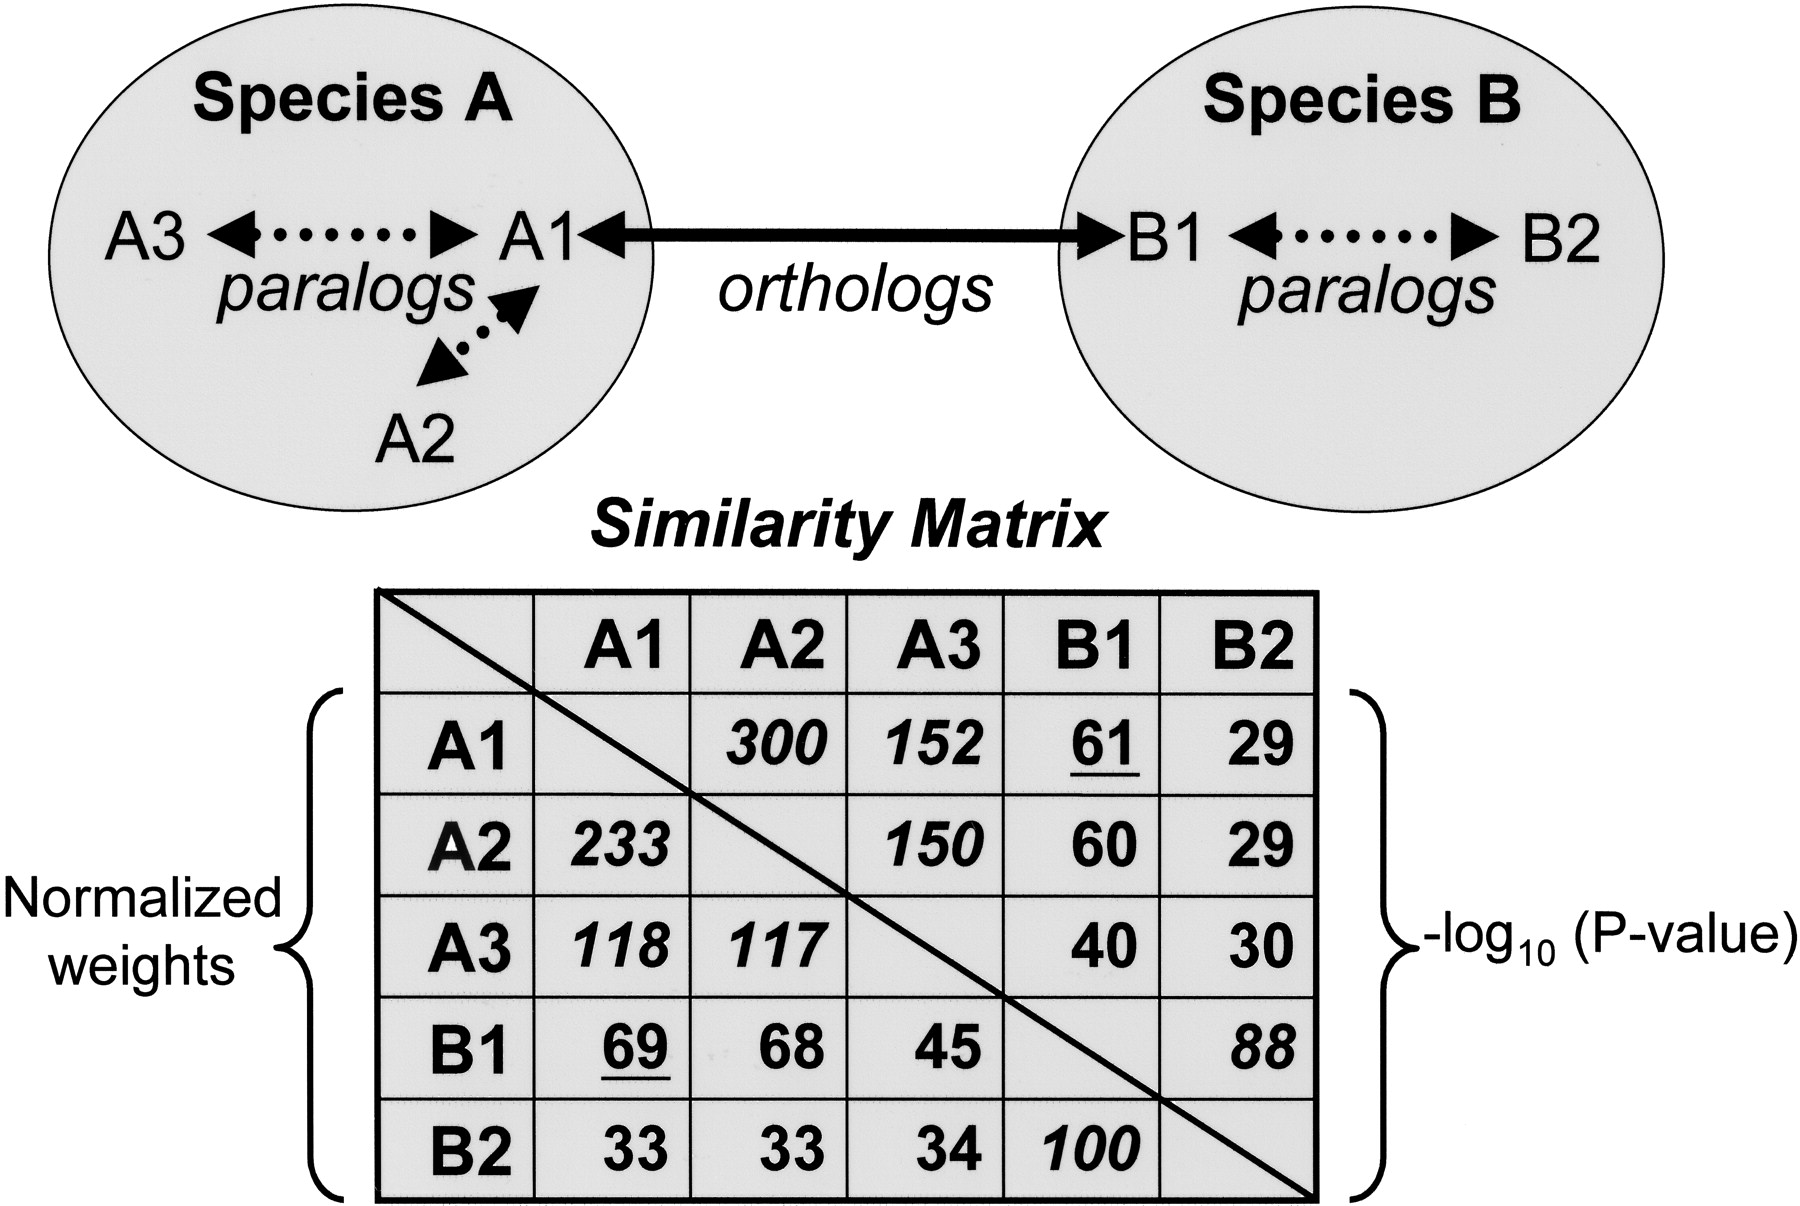
Illustration of sequence relationships and similarity matrix construction. Dotted arrows represent “recent” paralogy (duplication subsequent to speciation); solid arrows represent orthology. The upper right half of the matrix contains initial weights calculated as average –log10 (P-value) frompairwise WU-BLASTP similarities. The lower left half contains corrected weights supplied to the MCL algorithm; the edge weight connecting each pair of sequences wij is divided by Wij/W, where W represents the average weight among all ortholog (underlined) and “recent” paralog (italicized) pairs, and Wij represents the average edge weight among all ortholog pairs from species i and j. The net result of this normalization is to correct for systematic differences in comparisons between two species (e.g., differences attributable to nucleotide composition bias), and when i = j, to minimize the impact of “recent” paralogs (duplication within a given species) on the clustering of cross-species orthologs.


