
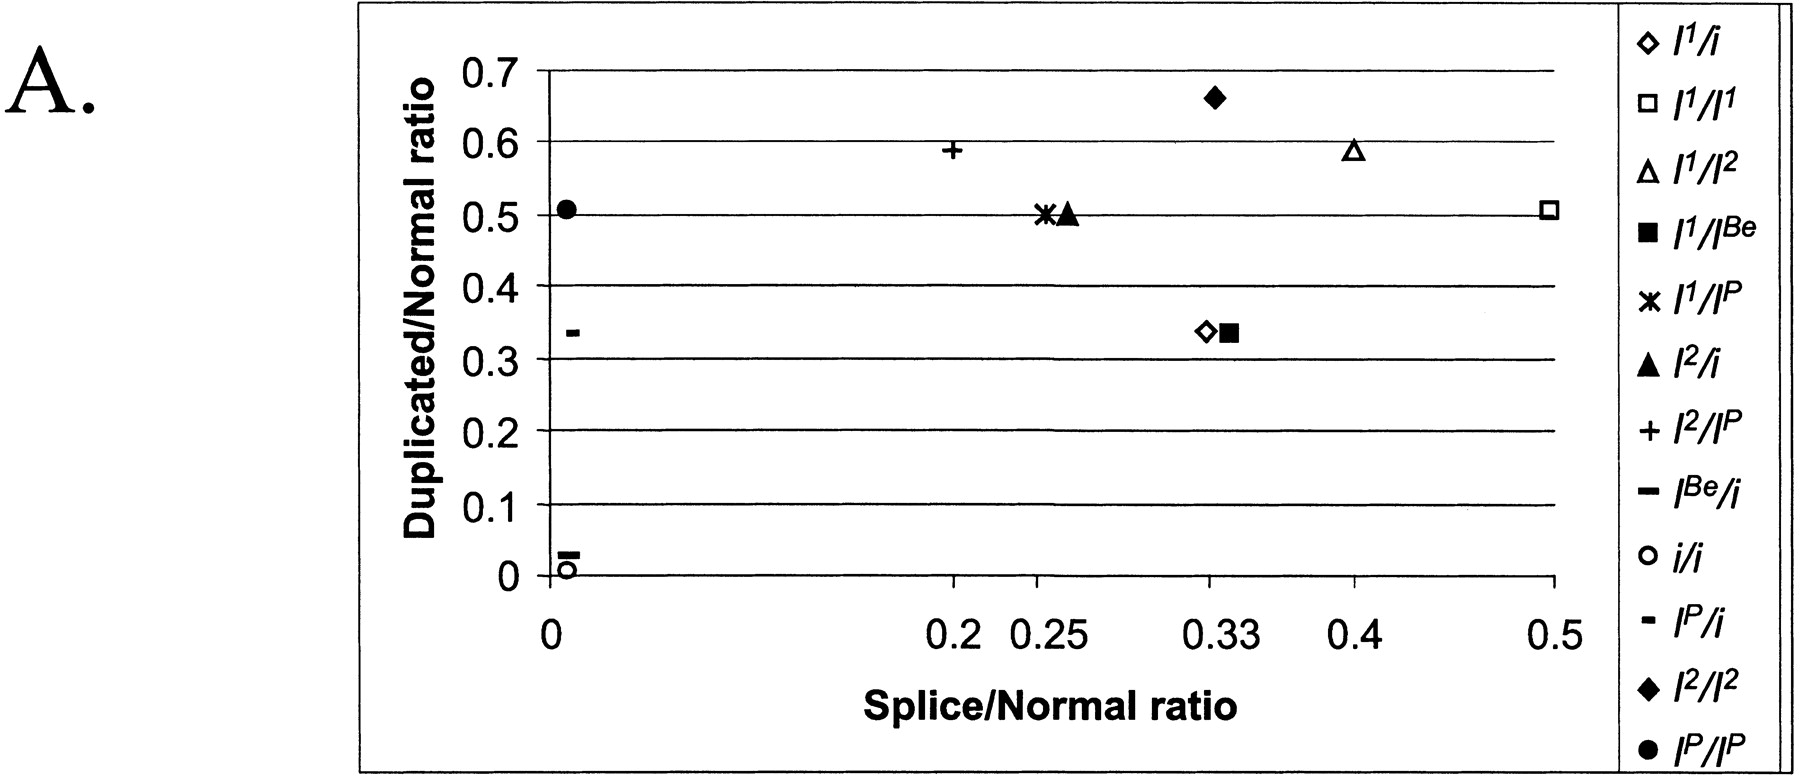
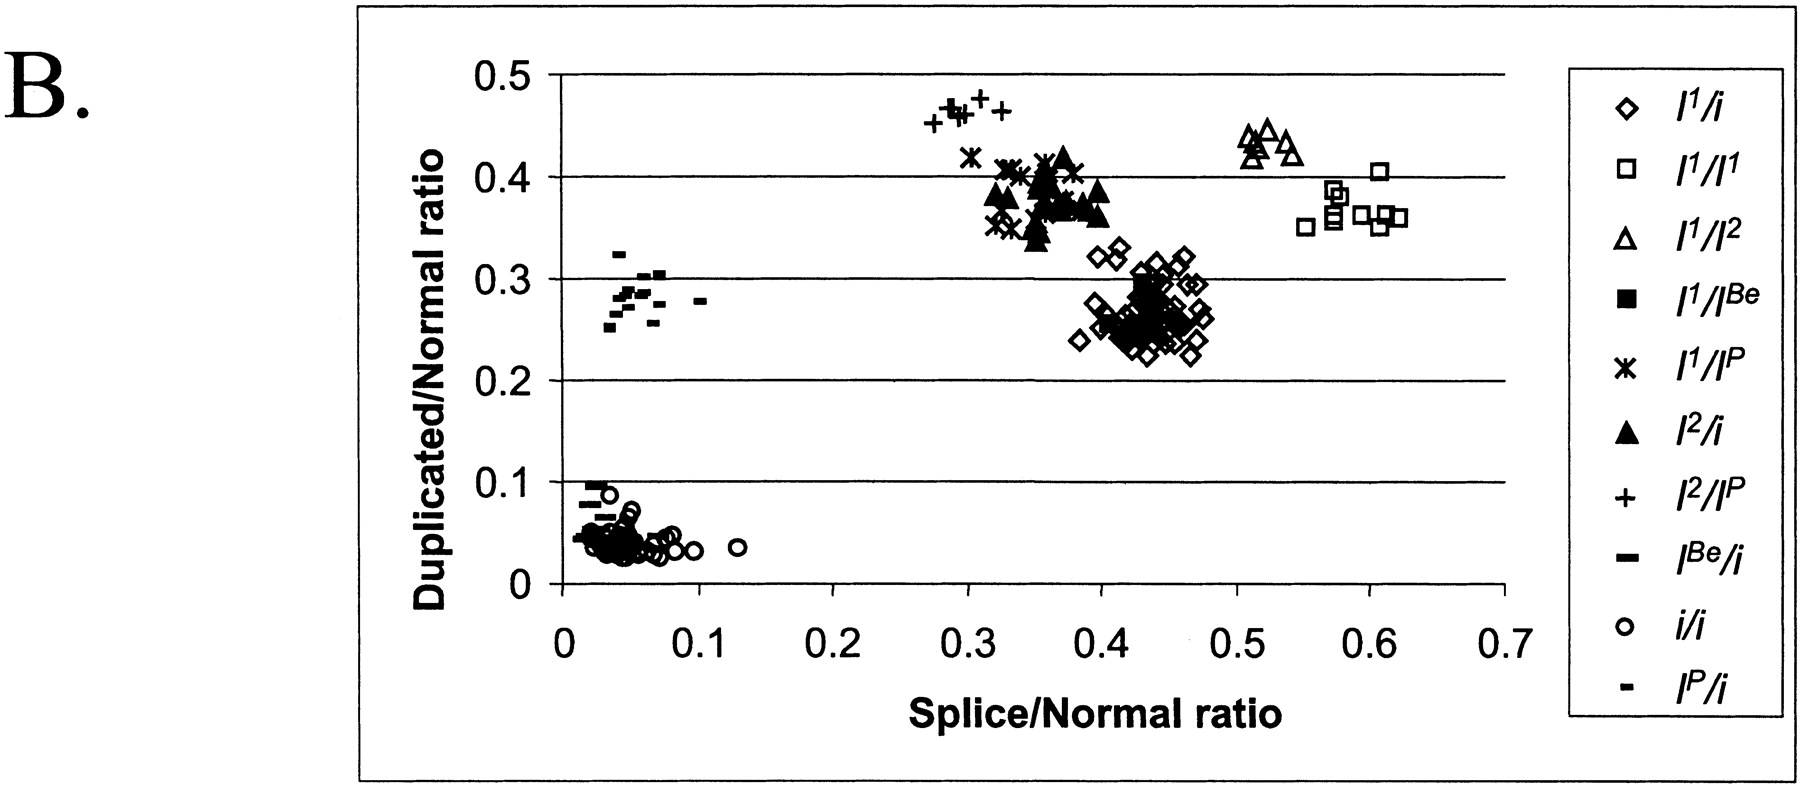
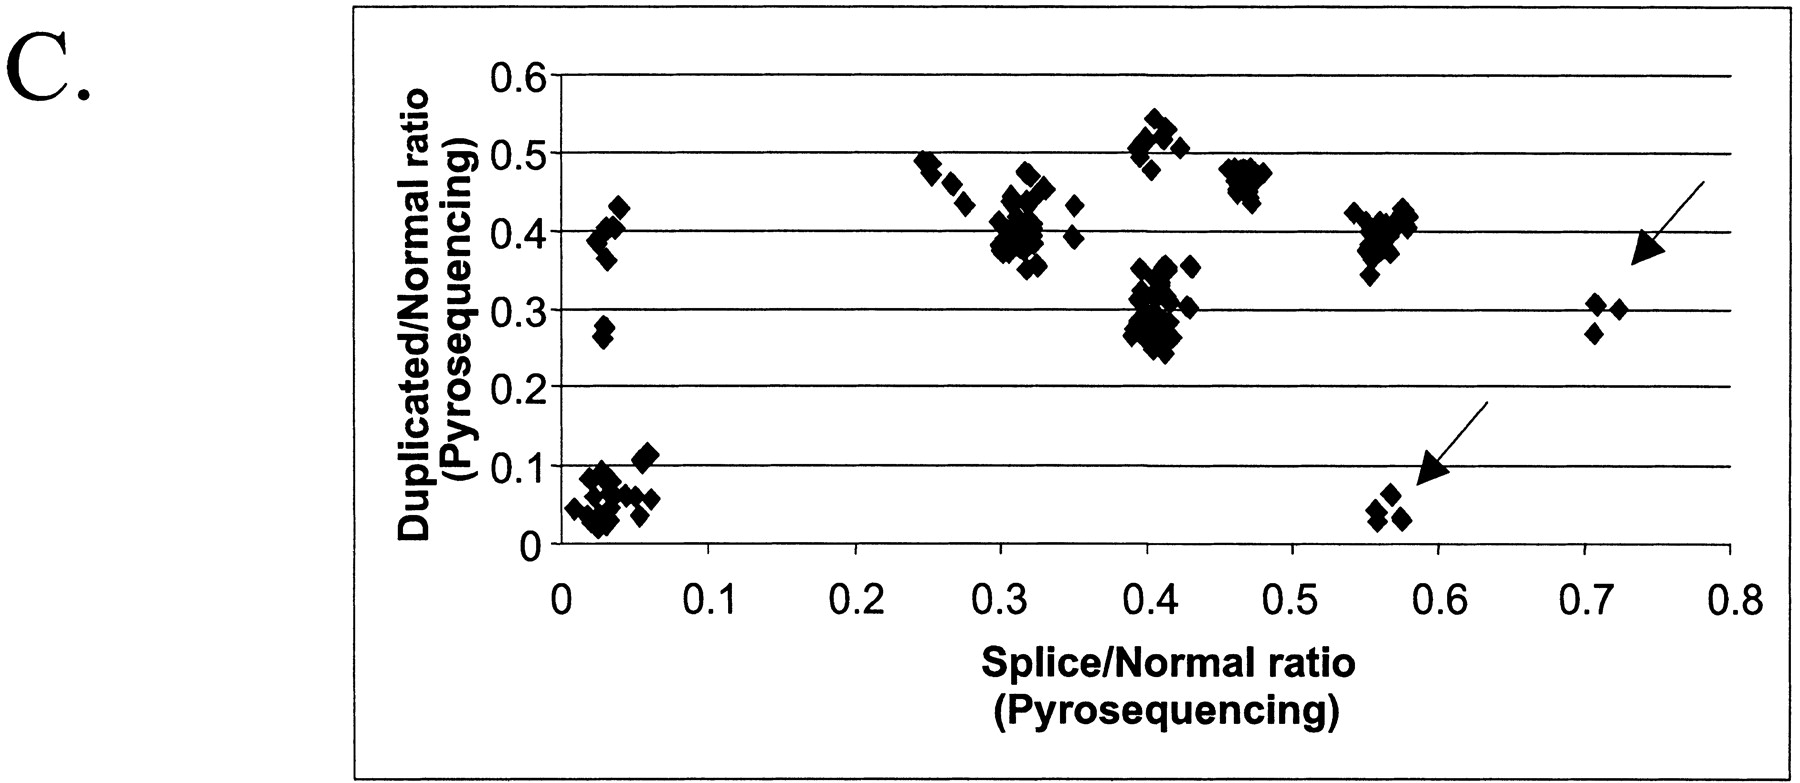
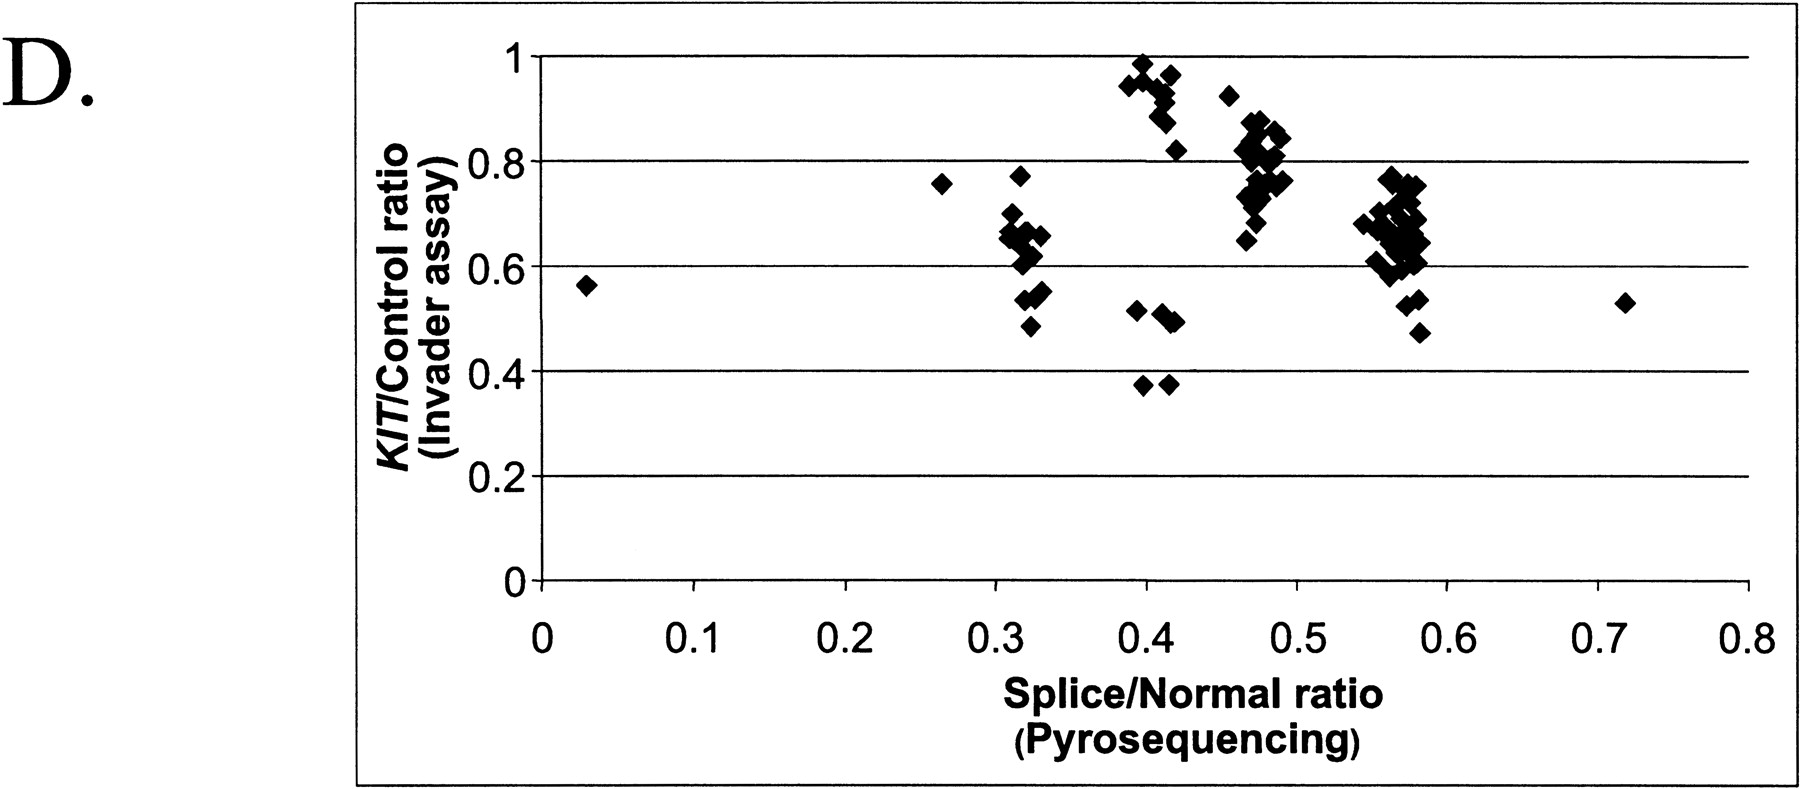
The combination of two different tests designed for the analysis of porcine KIT alleles. (A)The theoretical outcome. The genotypes included in the figure are all possible combinations of KIT alleles. The x-axis presents the ratio of splice mutation vs. normal, and the y-axis presents the ratio of duplicated vs. nonduplicated copies. Different genotypes are indicated by different symbols. (B) The analysis of pigs from a wild boar/Large White intercross: founders, n = 10; F1, n = 22; F2, n = 177. The x-axis shows the ratio [A/(A+G)] of splice mutation (A nt) to normal (G nt) at the first nt of intron 17 in the KIT gene. The y-axis shows the ratio [C/(C+G)] of duplicated copy (C nt) to nonduplicated copy (G nt) of the gene. (C) Analysis of 187 pigs from a synthetic white line (originally established by crossing Large White and Meishan breeds) segregating for color and suggesting the presence of most genotype classes predicted in (A). In addition, there is evidence of the existence of a new allele designated IL, because it has one KIT copy only but with the splice mutation. There were two groups of individuals presumably heterozygous for IL (indicated with arrows); one group with two copies and 50% splice (i or IBe/IL) and another group with three copies and 66% splice (I1/IL). (D) Combined analysis of the splice test and the Invader-based assay for estimating the number of KIT copies. The samples (n = 108) were from several commercial white lines.


