
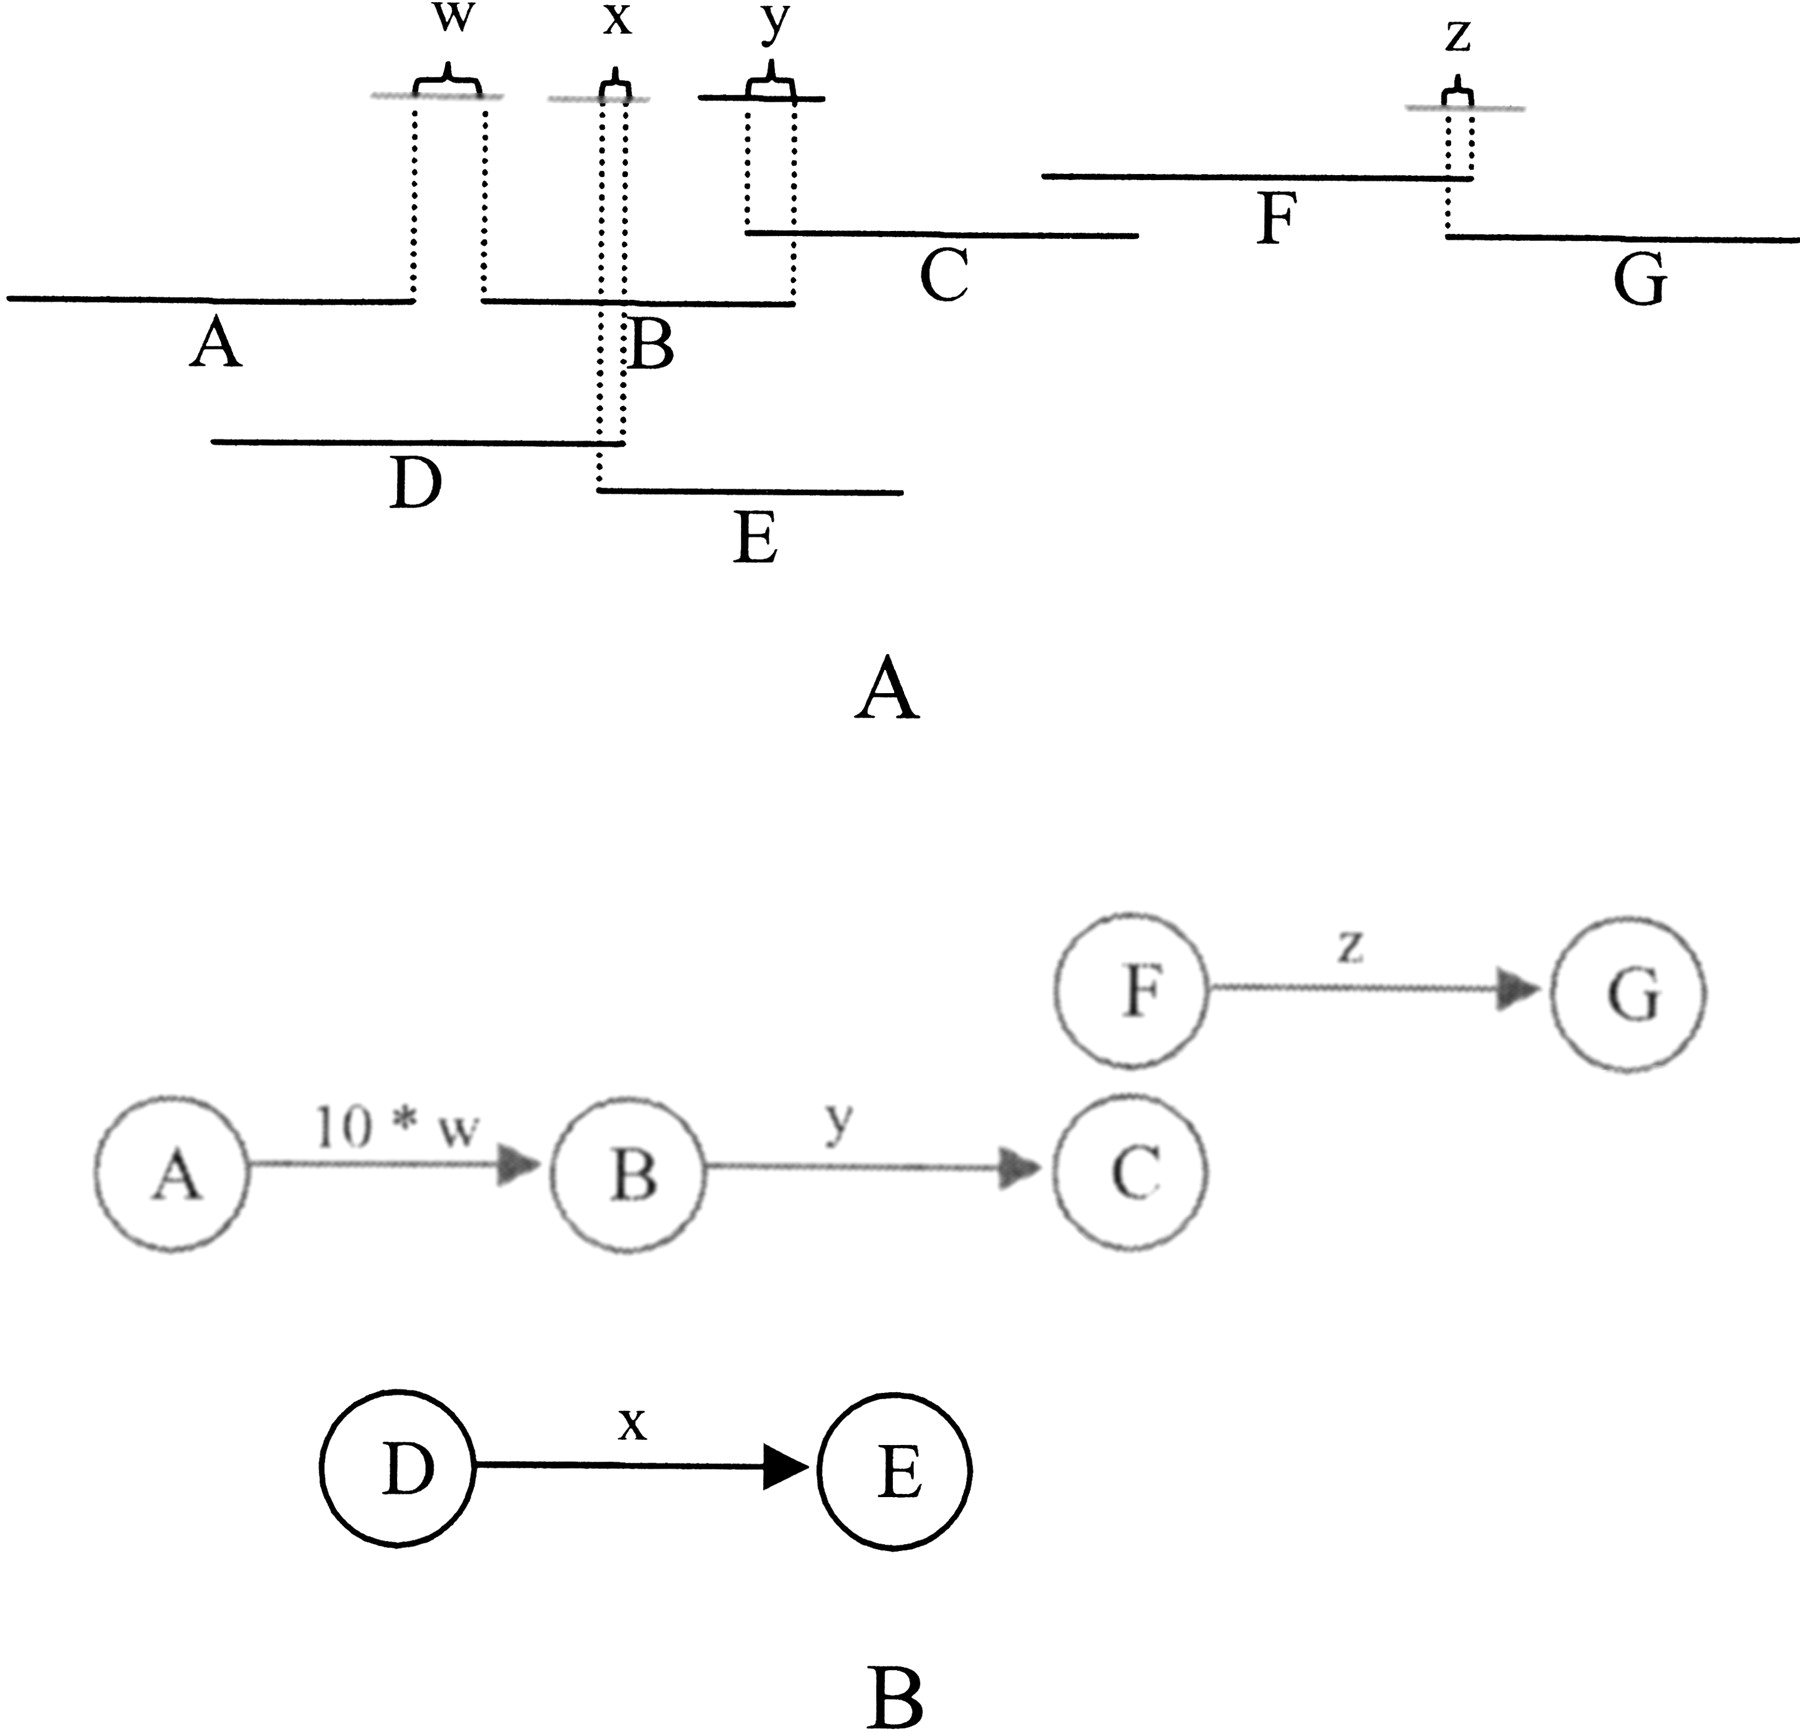
Figure 7
Construction of DAGs from overlapping clone pairs. (A) The amount of overlap or distance is recorded for all good clone pairs, shown as w, x, y, and z. (B) Clones define vertices, and pairs define edges, with edge weight determined by overlap or distance. If there is a gap between the clones, then the value is multiplied by 10. An MTP, shown in gray, is picked from the expressways. Note the junction from C to F, in which there is no sequence evidence that the clones overlap.


