
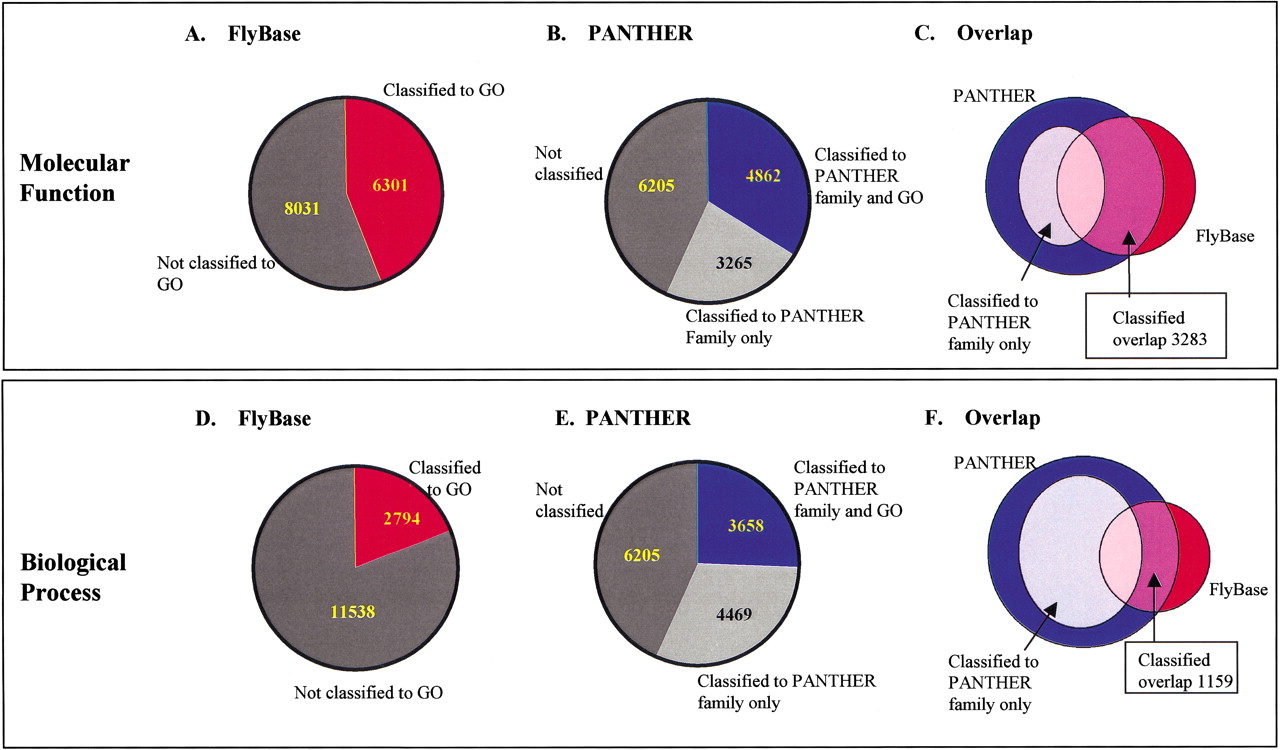
Coverage of Drosophila proteins classified by FlyBase and PANTHER. (A–C) Classification coverage for molecular function categories. (A) FlyBase associated 6301 proteins (red area) with at least one GO molecular function. (B) PANTHER associated 4862 proteins (blue area) with a GO molecular function. The light gray area indicates proteins that hit a PANTHER HMM, but were not associated with a GO term (see text for details), whereas the dark gray area indicates proteins that did not hit any PANTHER HMMs. (C) Venn diagram illustrating the overlap between proteins classified by FlyBase and PANTHER. (D–F) Classification coverage for biological process categories. (D) number of proteins classified by FlyBase, (E) number classified by PANTHER, and (F) the overlap between sets of proteins classified by the two methods.


