
Figure 2
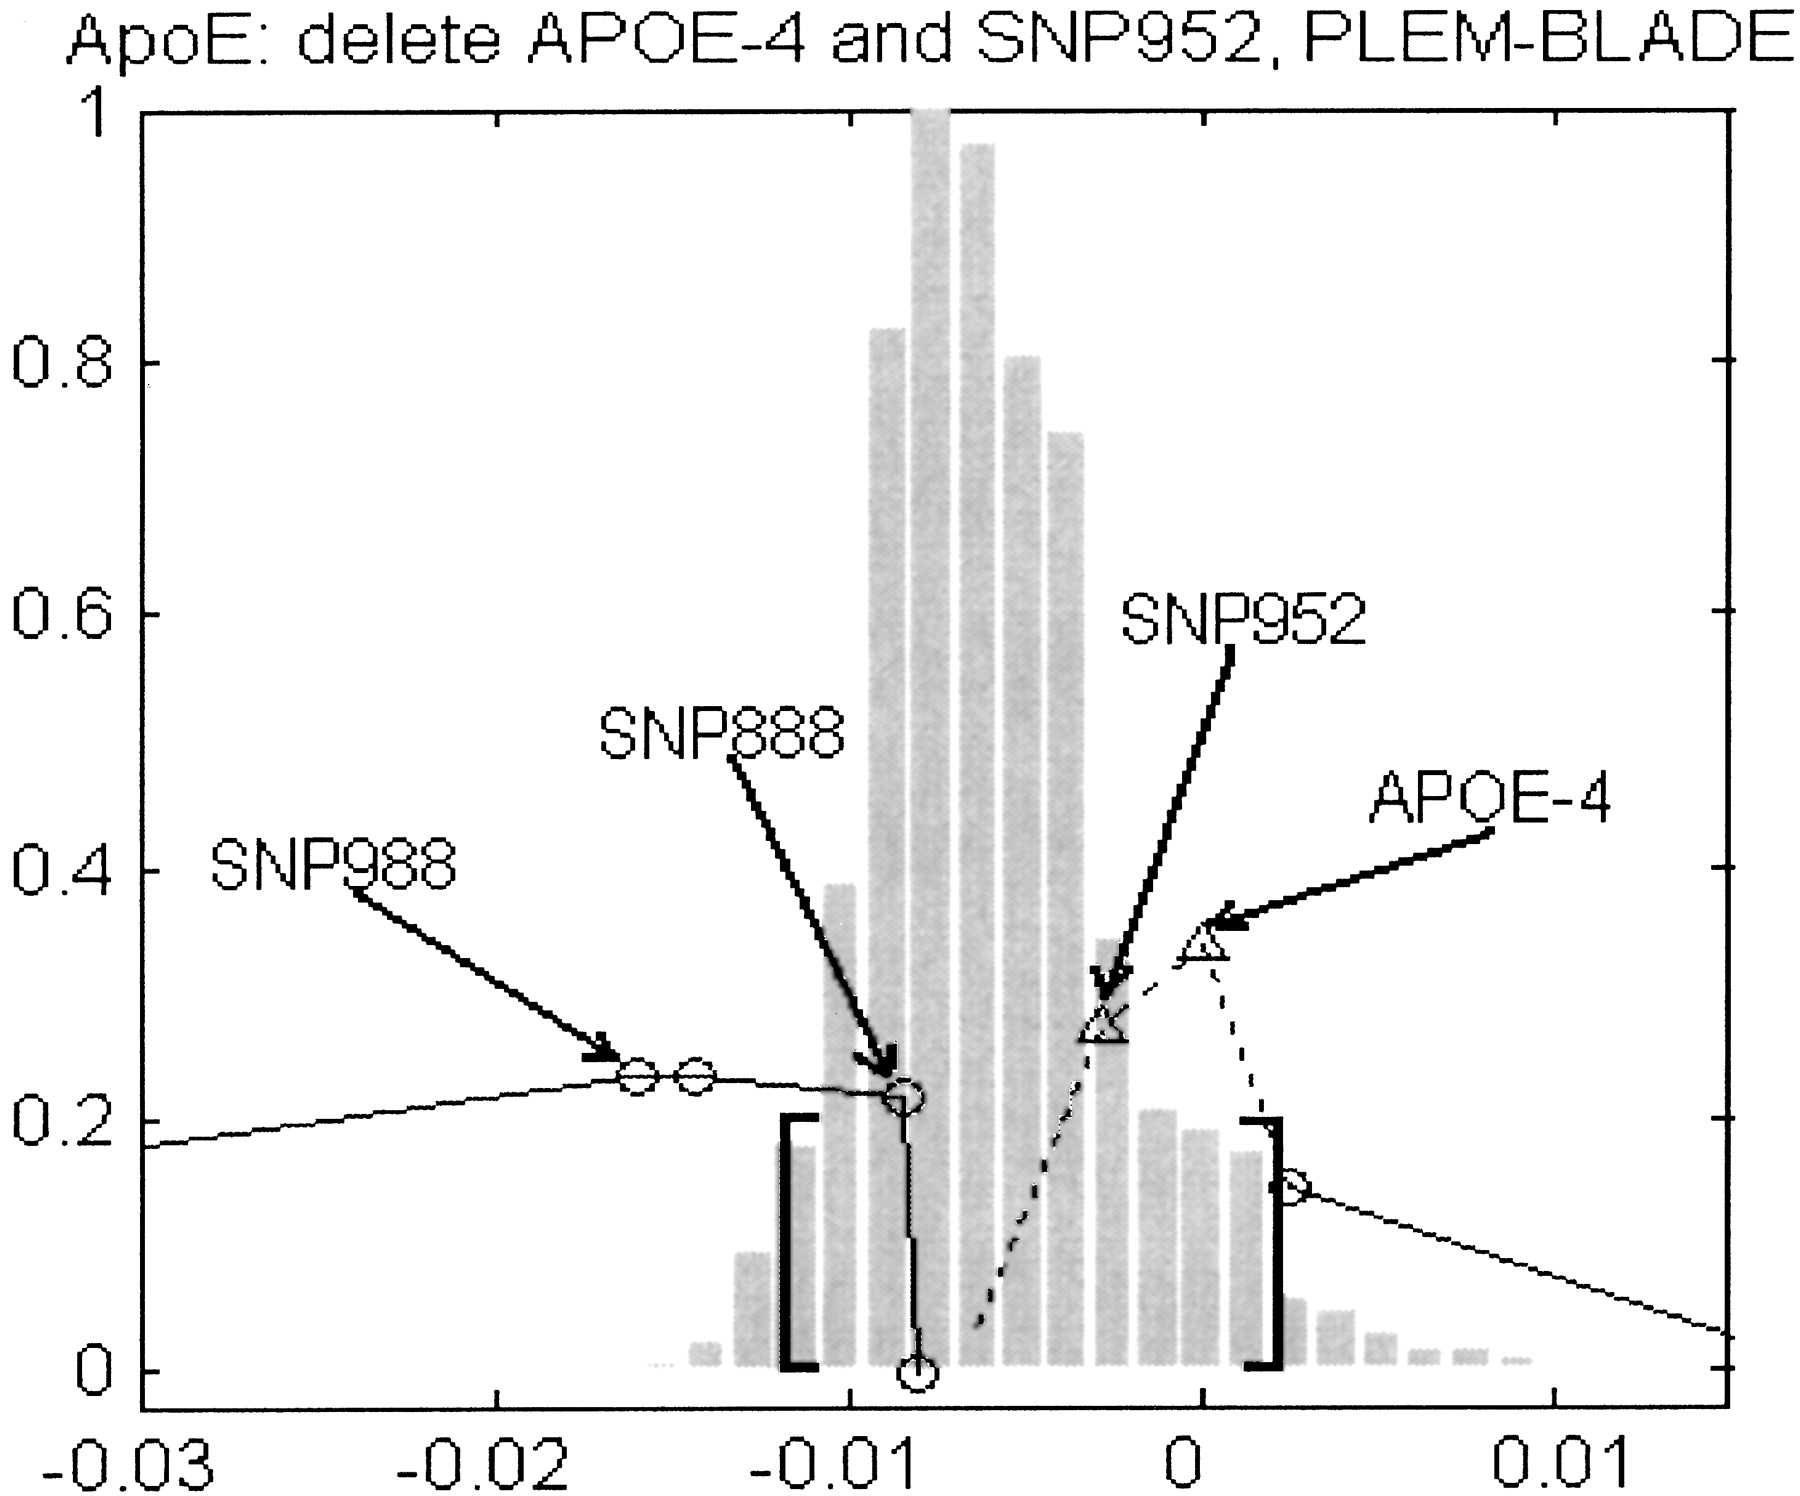
The histogram of posterior samples of the location parameter θ obtained by strategy B, with both APOE-4 and SNP952 deleted. The brackets denote the 95% PI bounds.
(Downloading may take up to 30 seconds. If the slide opens in your browser, select File -> Save As to save it.)
Click on image to view larger version.
The histogram of posterior samples of the location parameter θ obtained by strategy B, with both APOE-4 and SNP952 deleted. The brackets denote the 95% PI bounds.
 CiteULike
 Delicious
 Digg
Digg Facebook
 Google+
 Reddit
 Twitter
