
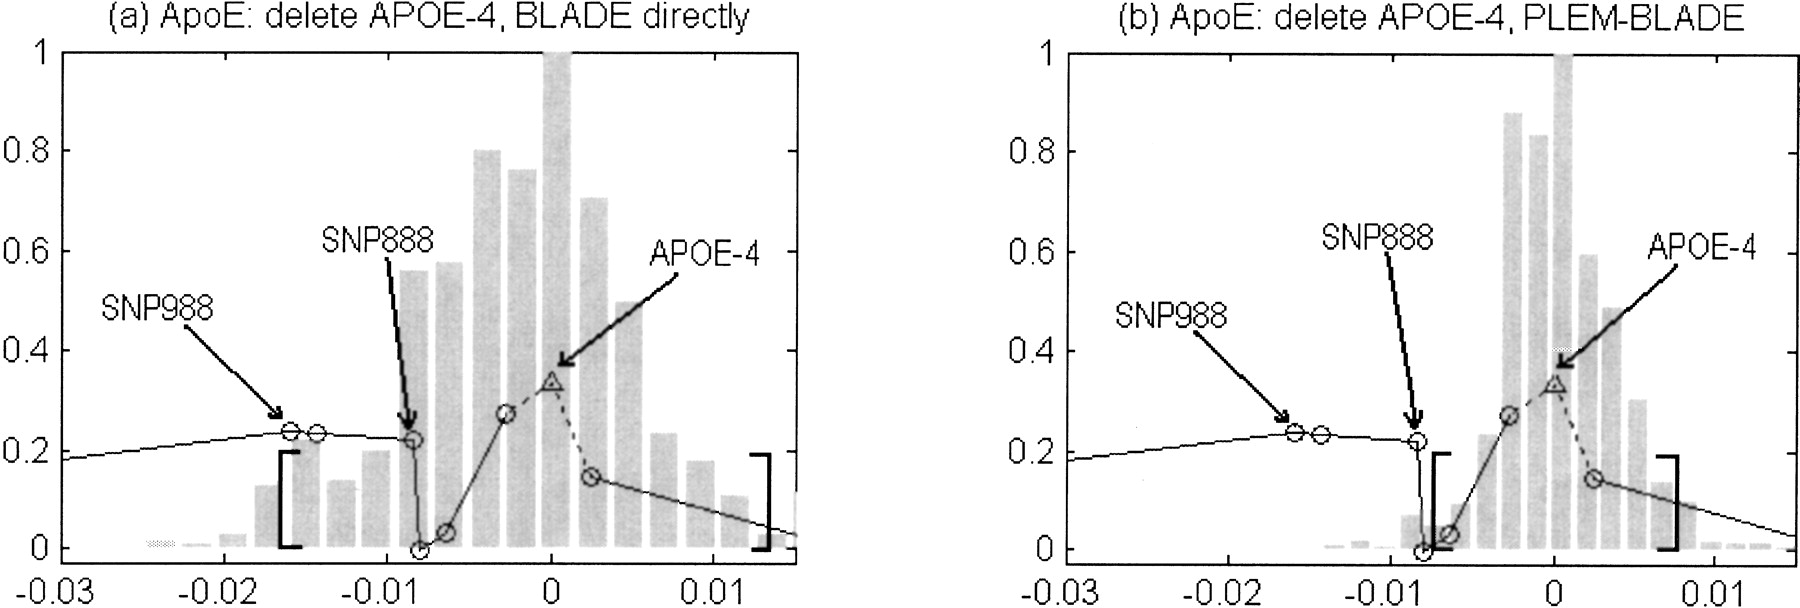
Figure 1
Histograms of the posterior samples of the position parameter θ with APOE-4 deleted. (a) Results of strategy A; (b) results of strategy B. The origin of the x-axis is set to be the position of APOE-4, and the distal direction to be positive. The circles denote the single-marker LD measurements, and the triangle indicates that marker APOE-4 was deleted in our Bayesian analysis. The brackets denote the 95% PI bounds.


