
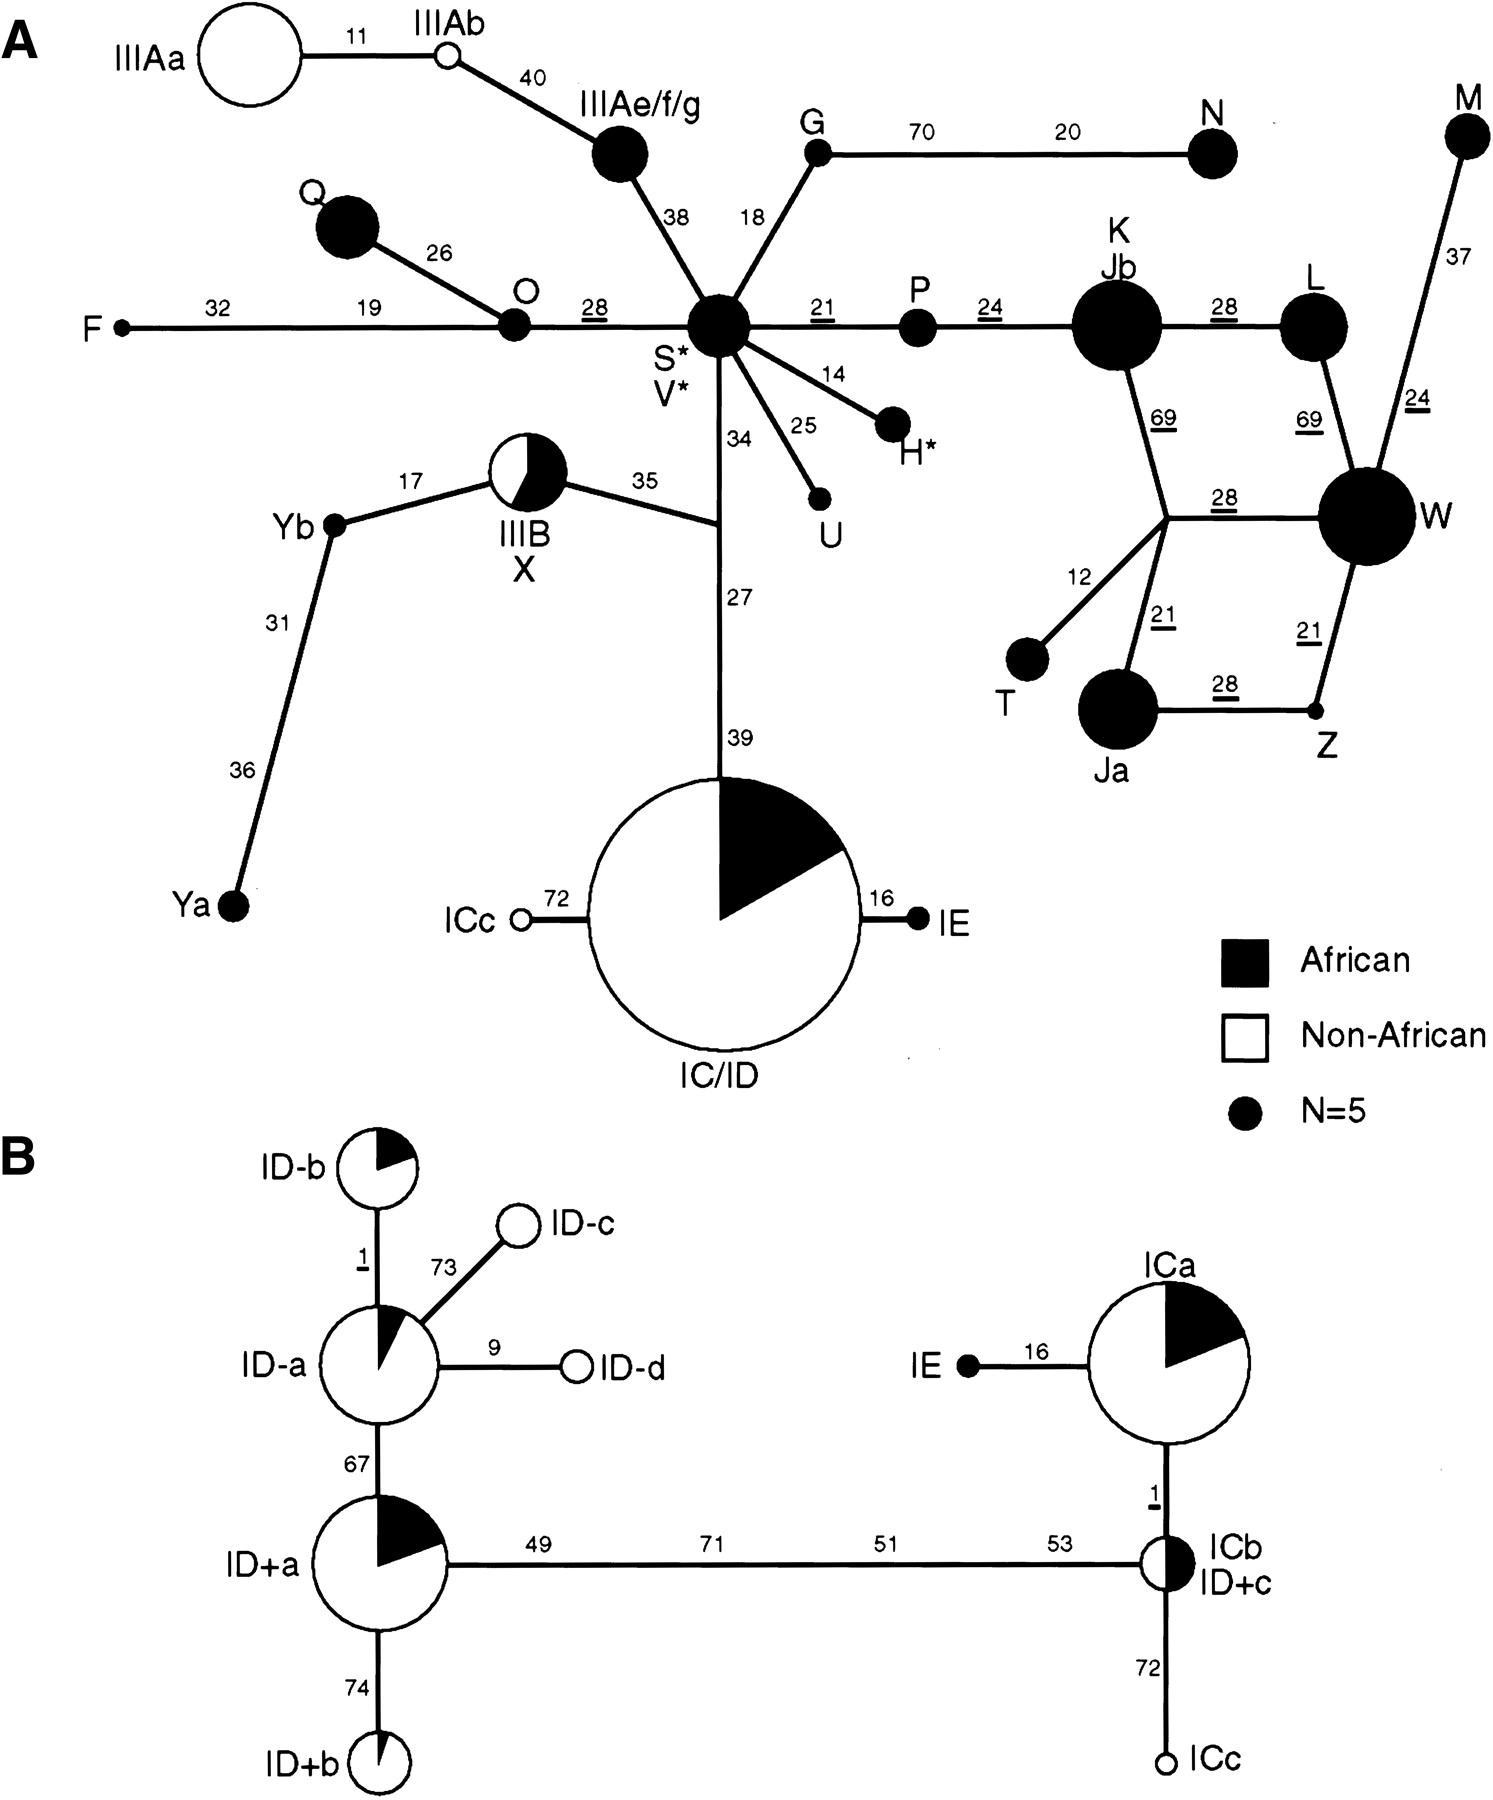
Median-joining (MJ) network analysis of the insulin gene region. (A) MJ network analysis of all haplotypes. MJ networks were based on 26 polymorphisms within a 3.6-kb region around the insulin minisatellite and including SNPs INS-11 to INS-40. Haplotypes are represented by circles, with areas reflecting the frequency of each haplotype group within the total African plus non-African data set. A reference circle representing n = 5 chromosomes is shown. African haplotypes are marked in black and non-African in white. The lengths of lines connecting haplotype nodes are proportional to the number of mutation steps separating lineages, with the identity of the SNPs mutated along each branch indicated. SNPs displaying homoplasy are underlined. The network was rooted by comparison with primate sequences at the African-specific haplotypes S, V, and H (indicated by stars). (B) MJ network analysis of sublineages of lineage I chromosomes. Relationships between sublineages were resolved by network analysis using all markers across the 7.8-kb haplotype.


