
Figure 3
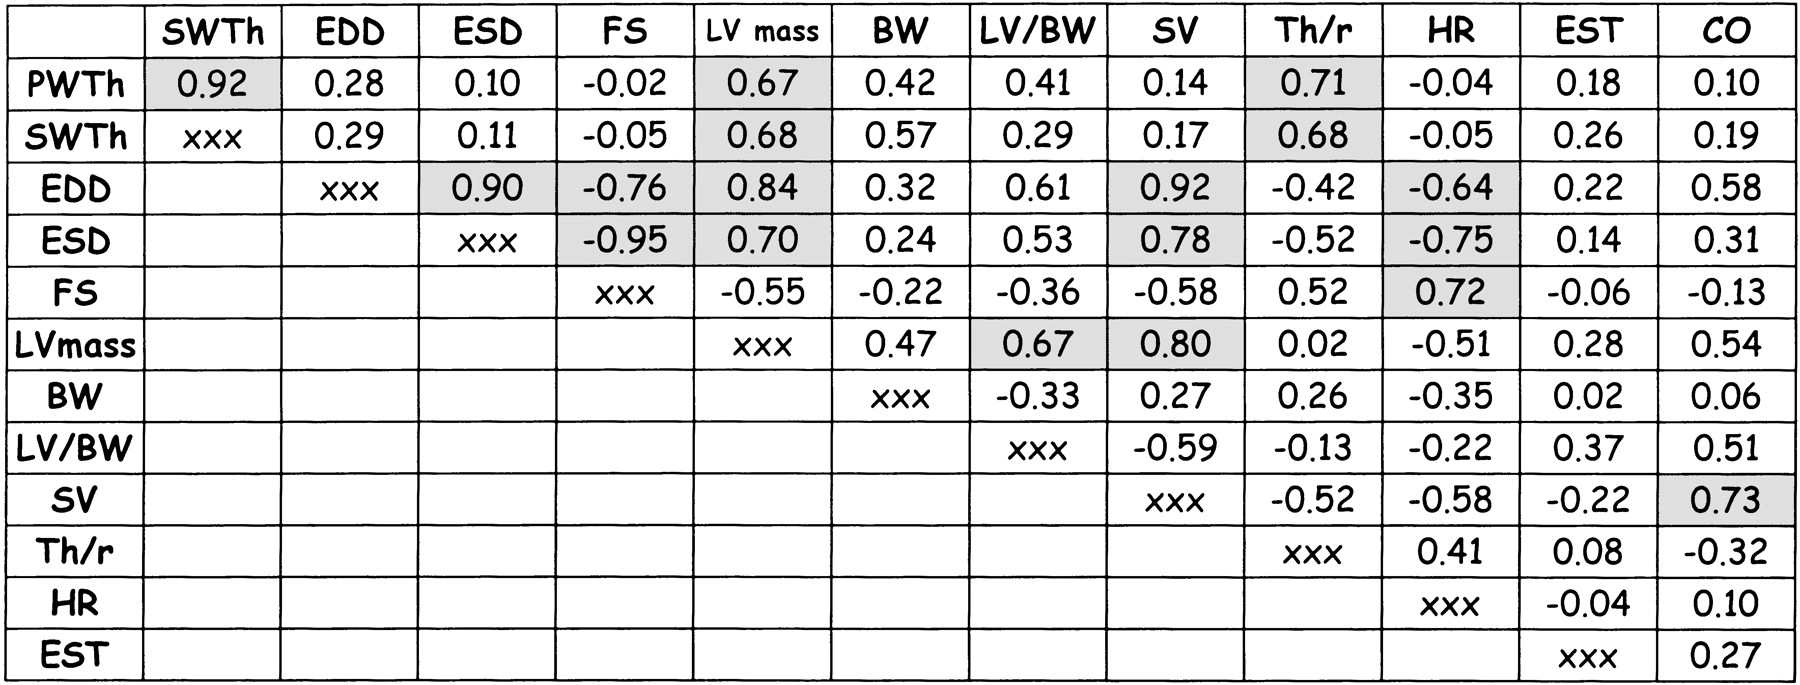
Cosegregation of CV traits among the AXB/BXA RI strains. Gray cells indicate statistically significant correlations (P < 0.05, after correction for multiple testing).
(Downloading may take up to 30 seconds. If the slide opens in your browser, select File -> Save As to save it.)
Click on image to view larger version.
Cosegregation of CV traits among the AXB/BXA RI strains. Gray cells indicate statistically significant correlations (P < 0.05, after correction for multiple testing).
 CiteULike
 Delicious
 Digg
Digg Facebook
 Google+
 Reddit
 Twitter
