
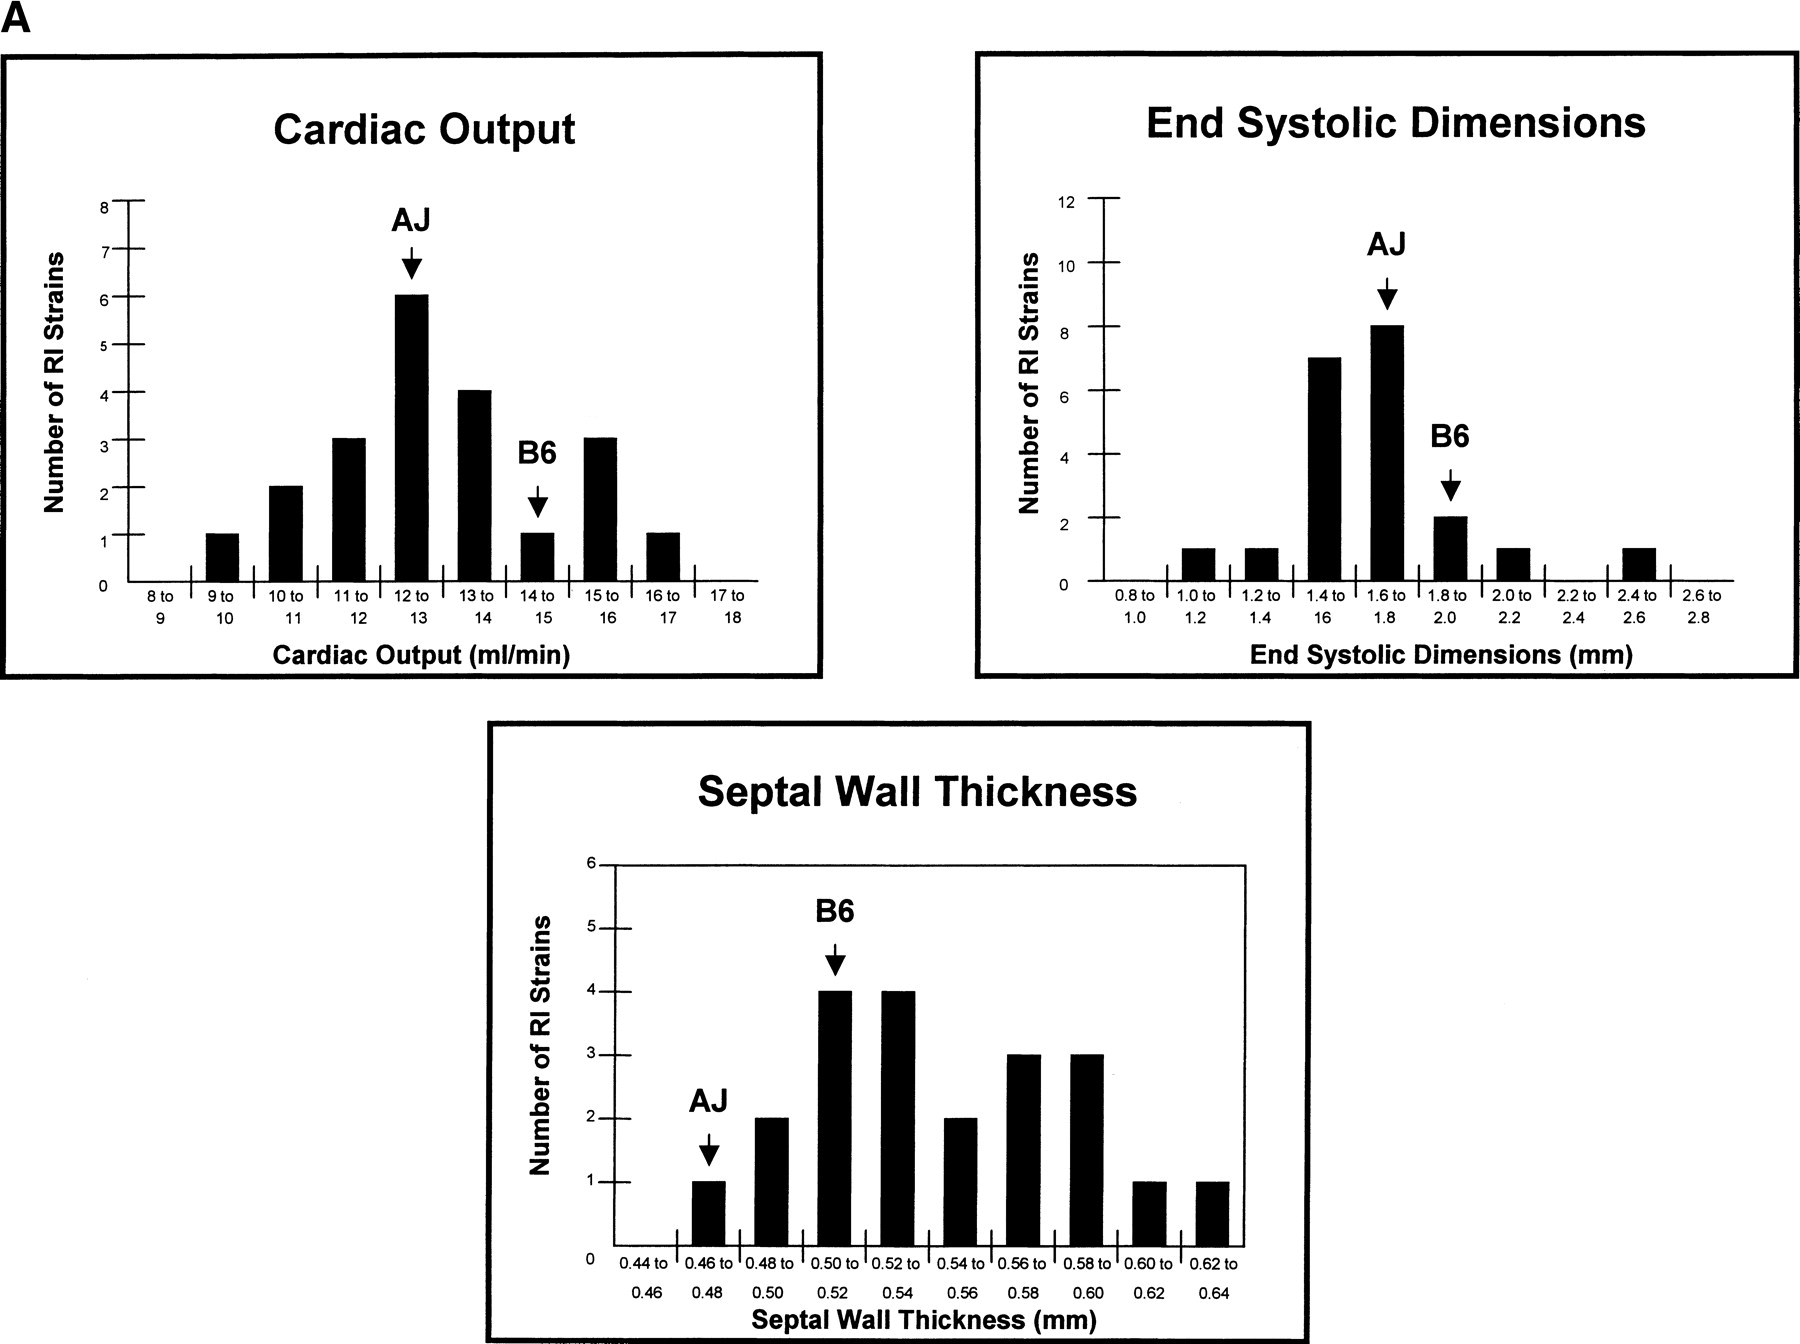
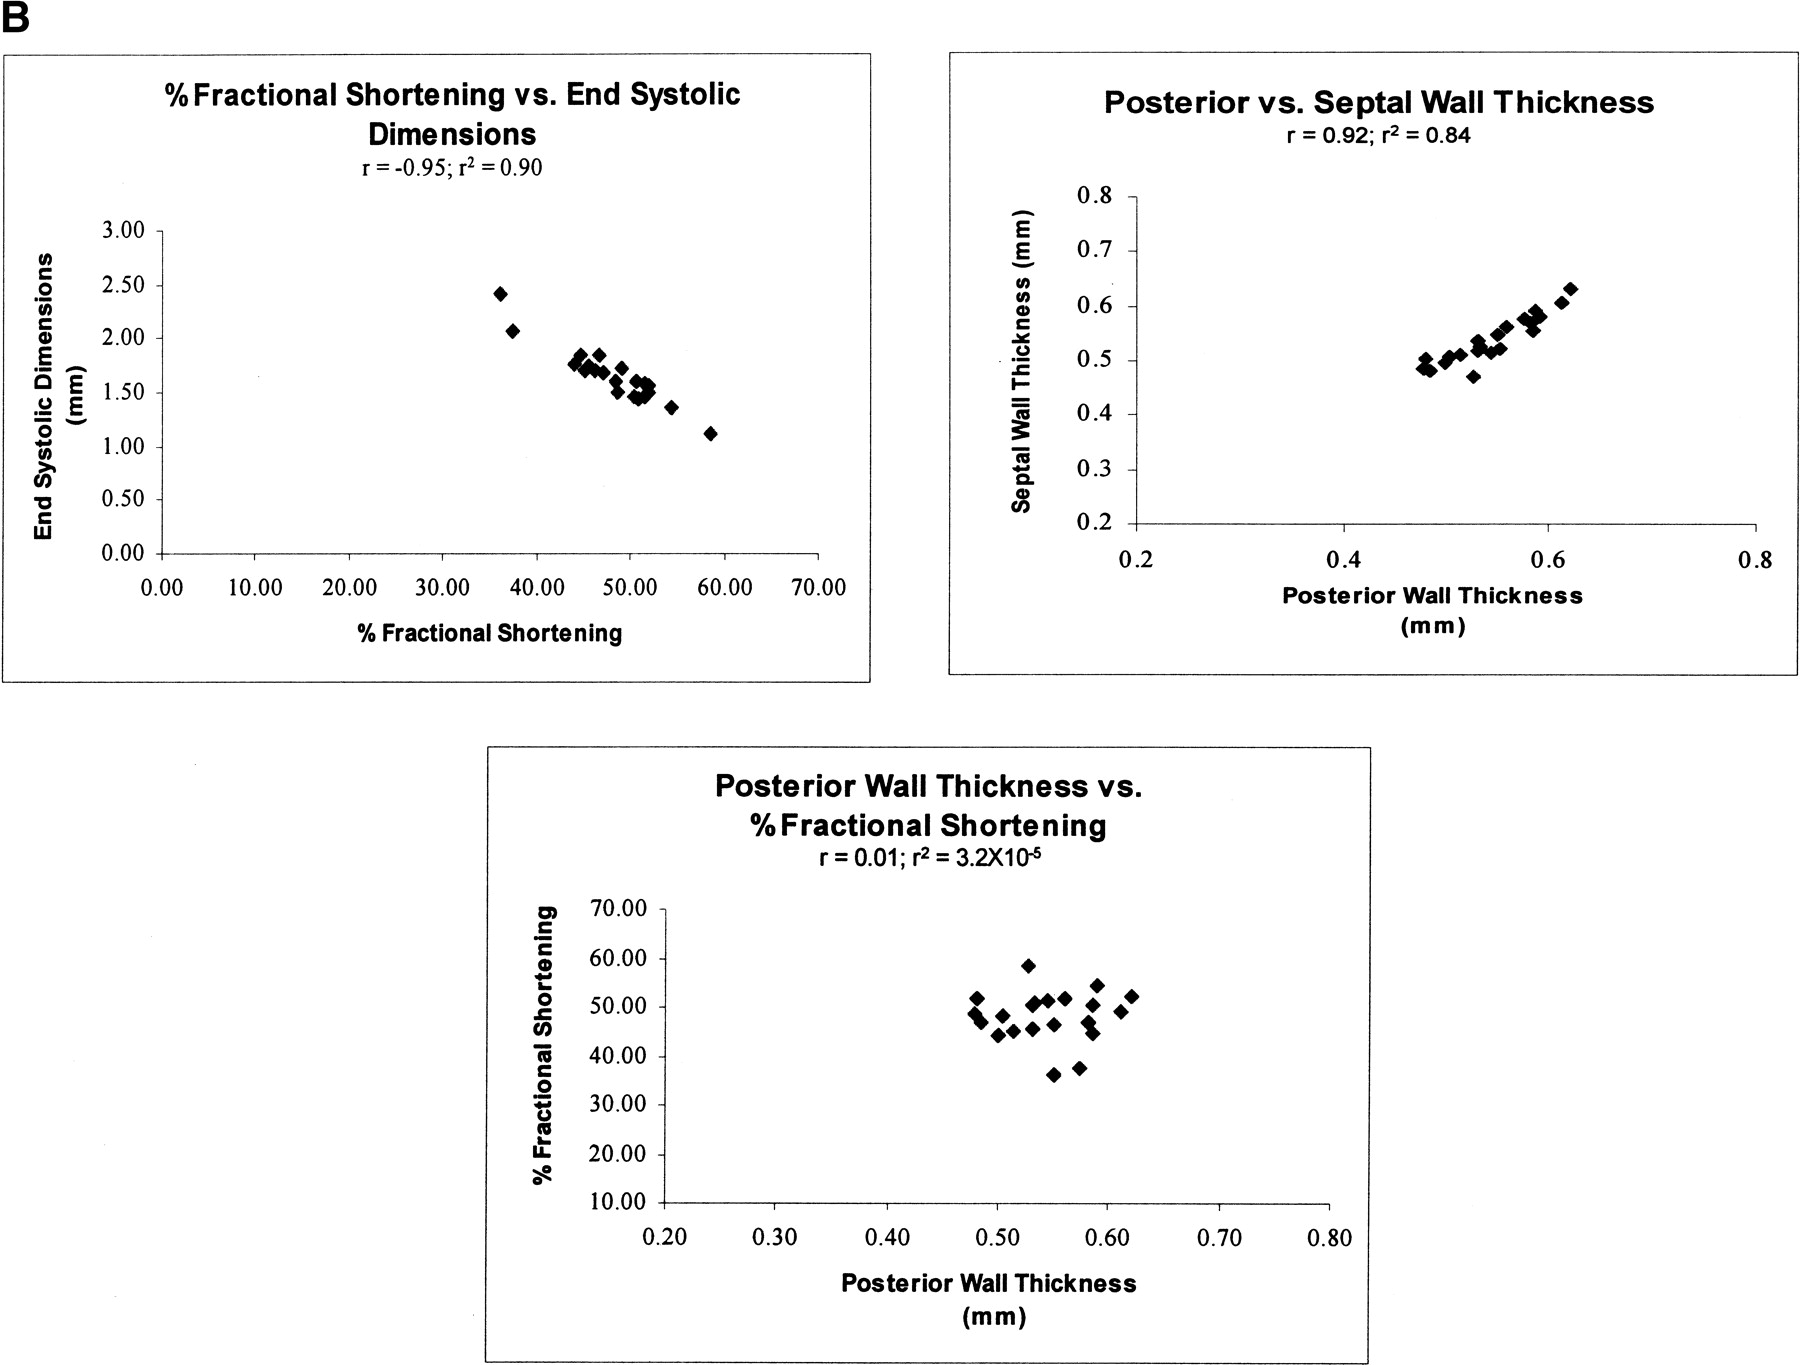
Figure 2
Frequency distributions and cosegregation patterns for selected CV traits. (A) Frequency distribution of mean values for selected CV traits among the AXB/BXA RI strains. The mean values for the parental strains are marked. (B) Cosegregation of selected CV traits among the 21 AXB/BXA RI strains.


