
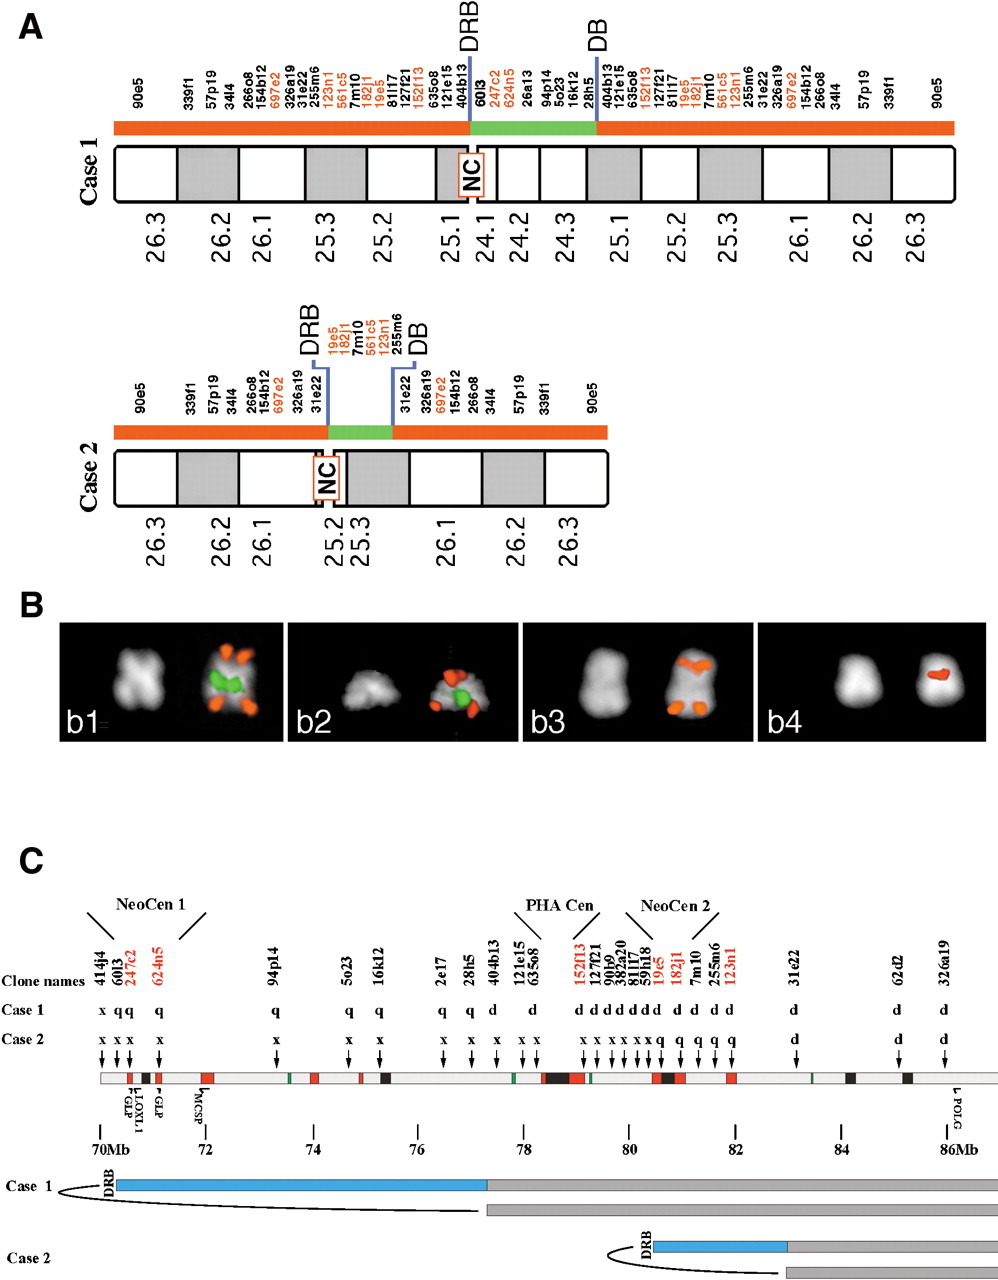
Delineation of neocentromeres in 15q24-26. (A) results of FISH experiment performed on the two marker chromosomes showing neocentromere (NC) emergence using a large panel of probes located in the interval HSA15q24-qter. BAC probe names are shown, with BACs which are duplicated in both HSA and PHA shown in red (for details see text). (B) examples of FISH experiments. Panel b1: Case 1: co-hybridization of BACs RP11-90e5 (red) and RP11-26a13 (green). b2: Case 2, BAC RP11-90e5 (red signal) cohybridized with BAC 182j1 (green). b3: Case 1, RP11-57p19. b4: Case 2, BAC RP11-19e5. The map position of probes used in FISH experiments is shown in (A). The asymmetric position of the centromere is evident from the DAPI staining. Centromere position was inferred from chromosome morphology, as evident from DAPI, and from proximity of FISH signals of the two chromatids that reaches its maximum at the centromere. (C) Position of neocentromeres relative to ancestral centromere and features within 15q24-26. Human BACs used to probe PHA metaphases are indicated, together with the result of the hybridization on each marker chromosome. p, p arm only; q, q arm only; d, p and q arm, flanking the centromere; x, no signal. Sequence features are as in Fig. 2. DRB, duplication and rearrangement boundary; DB, duplication boundary. Neocentromere 1 maps between BACs 60I3 and 94P19, and neocentromere 2 maps between BACs 19E5 and 7M10. The locations of two genes have been added to allow comparison with the map of the DUP25 region; from left to right these are LOXL1 and POLG. The proximal breakpoint leading to DUP25 formation (Gratacos et al. 2001) maps close to the DRB of Case 1. In addition, the position of the potentially functional copies of golgin (GLP) and chondroitin (MCSP) are shown.


