
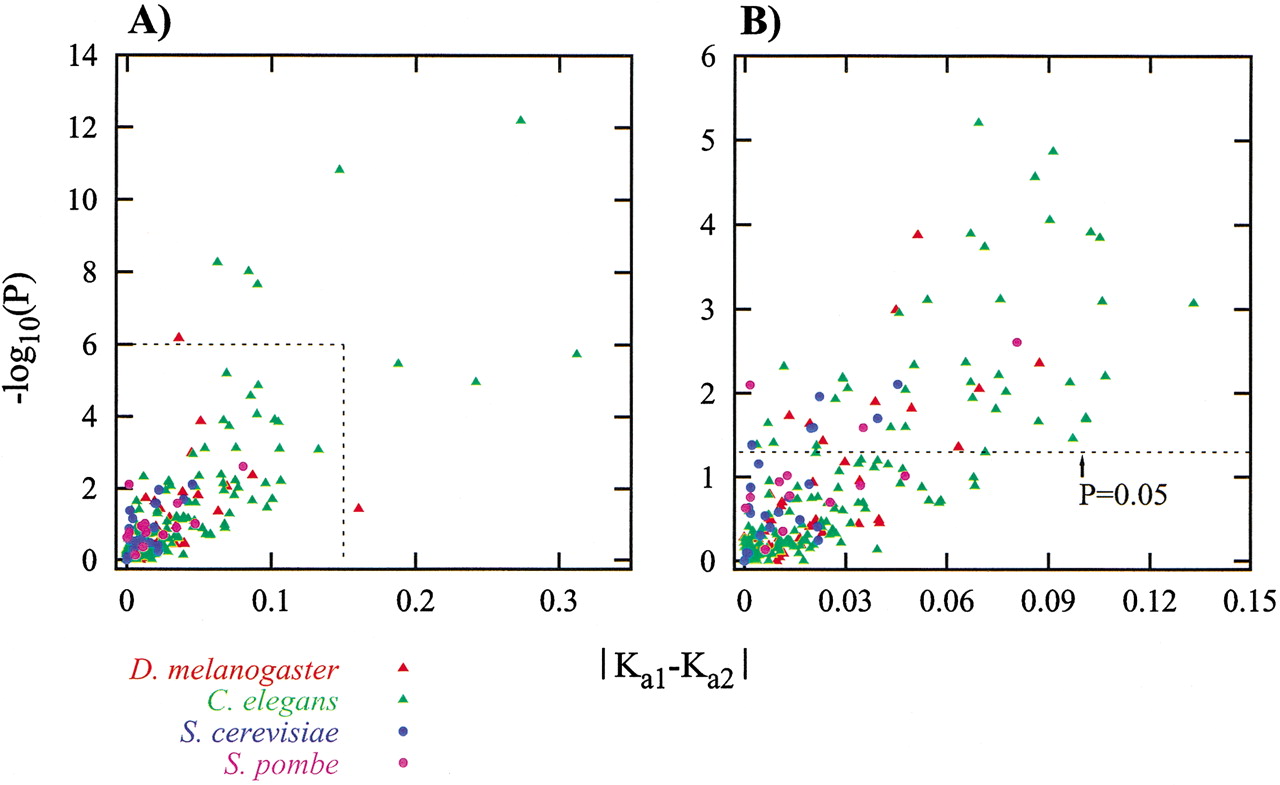
Figure 2
Significance of observed differences in Ka. On the X-axis is plotted the absolute value of the difference in Ka value between two duplicates. The Y-axis gives the negative logarithm (to base 10) of the P value for that pair. (A) All asymmetric duplicate pairs shown. (B) Only the square region marked in panel A is shown. The dashed line in B shows the significance level of P = 0.05.


