
Figure 1
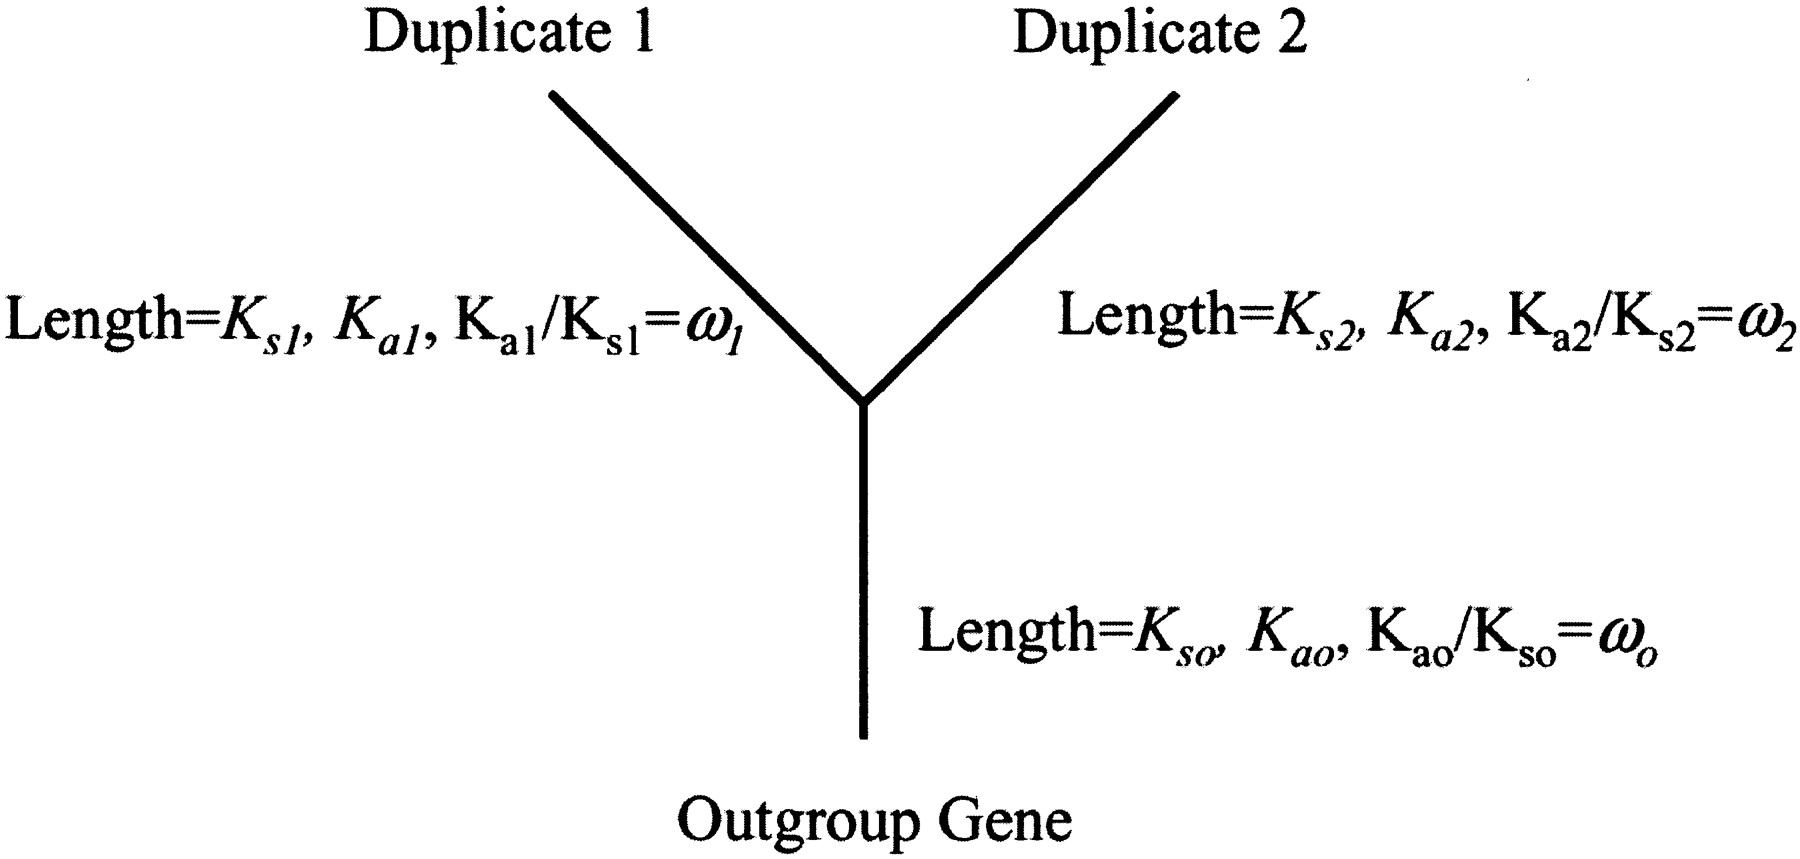
Schematic representation of our model tree. Two duplicates are presumed to have diverged from an outgroup gene. Each of the three branches of this tree is allowed to have its own Ks and Ka values.
(Downloading may take up to 30 seconds. If the slide opens in your browser, select File -> Save As to save it.)
Click on image to view larger version.
Schematic representation of our model tree. Two duplicates are presumed to have diverged from an outgroup gene. Each of the three branches of this tree is allowed to have its own Ks and Ka values.
 CiteULike
 Delicious
 Digg
Digg Facebook
 Google+
 Reddit
 Twitter
