
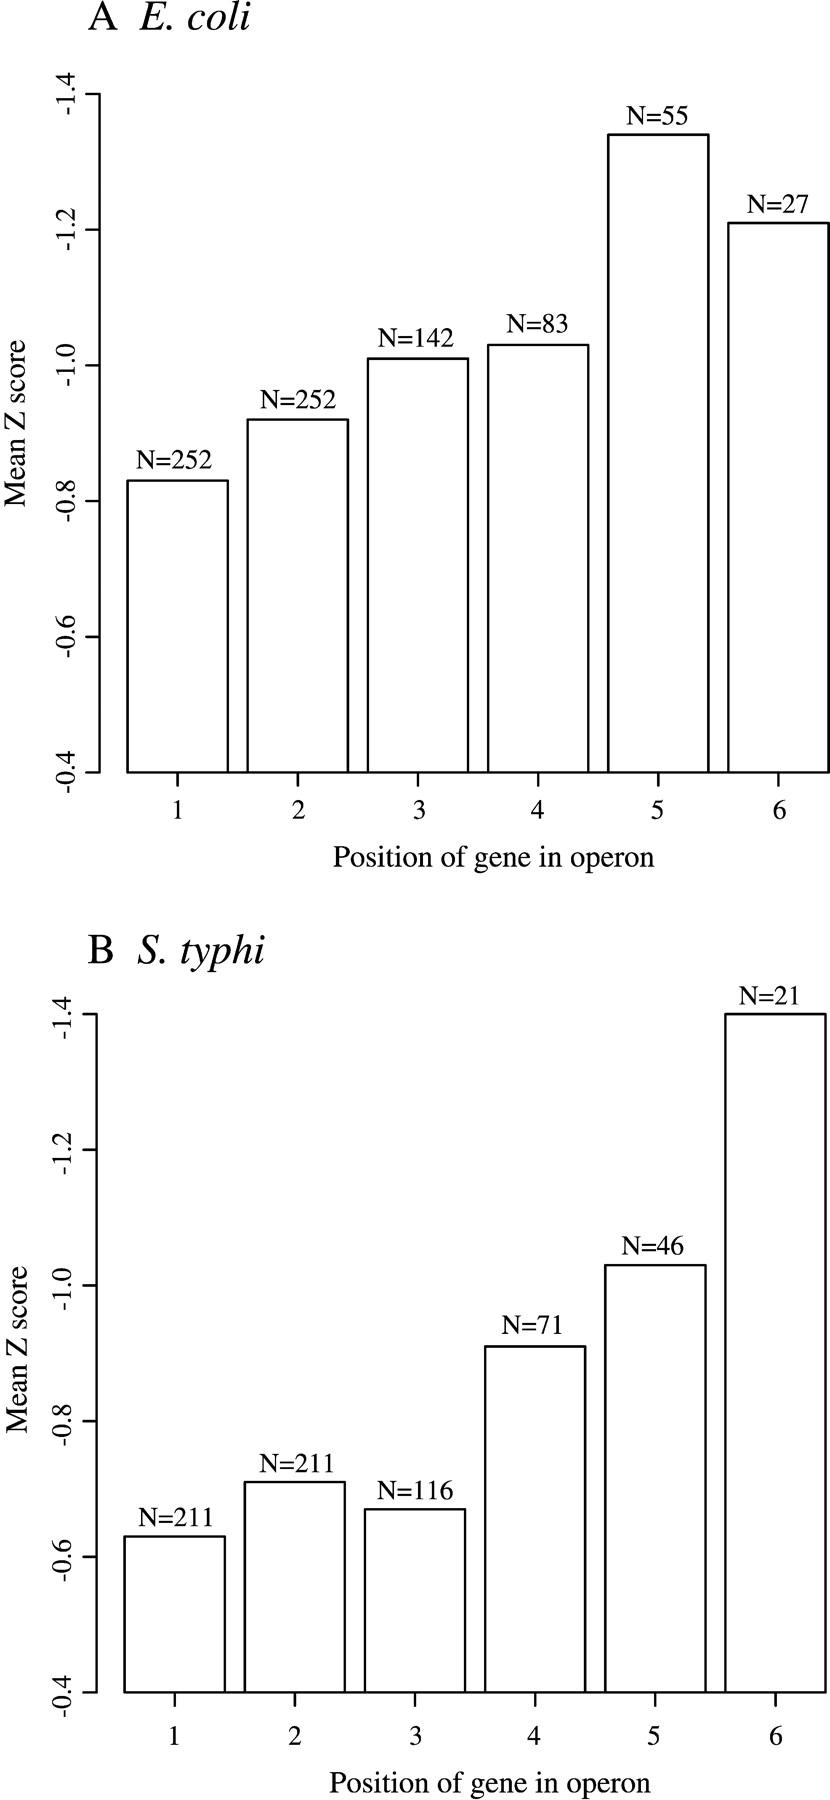
Figure 3
Bias for secondary structure in bacterial operons. Operons were classified on the basis of their locations in annotated polycistronic messages, and the average Z score was calculated for each subset. Numbers 1–6 correspond to the location of genes within operons relative to the 5′ end of the transcript. Genes in position 7or higher within operons are not shown. The number of genes in each data set is indicated.


