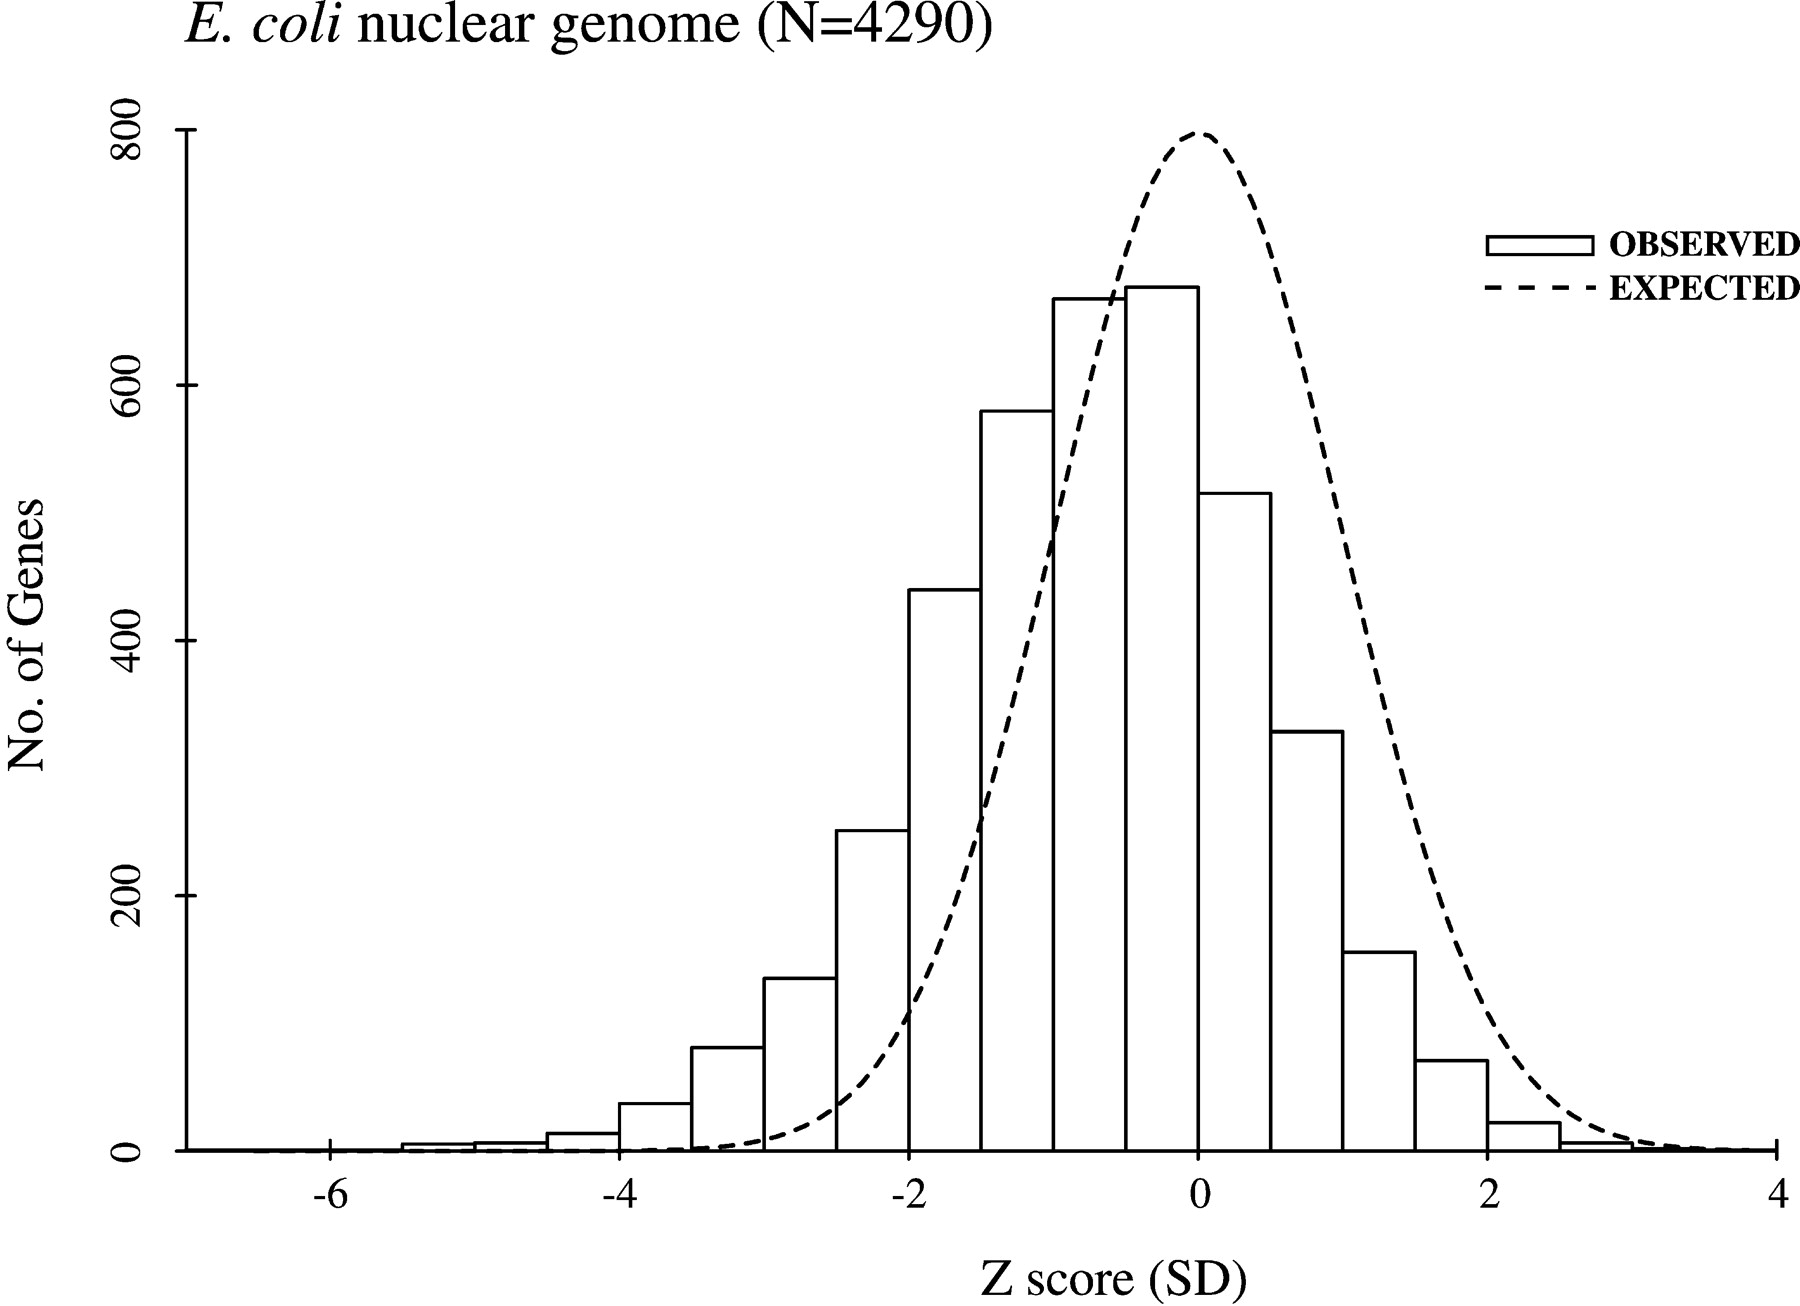
Widespread Selection for Local RNA Secondary Structure in Coding Regions of Bacterial Genes

(Downloading may take up to 30 seconds. If the slide opens in your browser, select File -> Save As to save it.)

Click on image to view larger version.

Figure 1
Figure 1

Distribution of Z scores for E. coli genes. Each gene in the E. coli genome was shuffled 20 times, and a Z score was calculated for each as described in the text. A histogram of these Z scores (solid) and a standard normal distribution (dashed) are shown.

This Article

  1. Genome Res. 13: 2042-2051

Preprint Server