
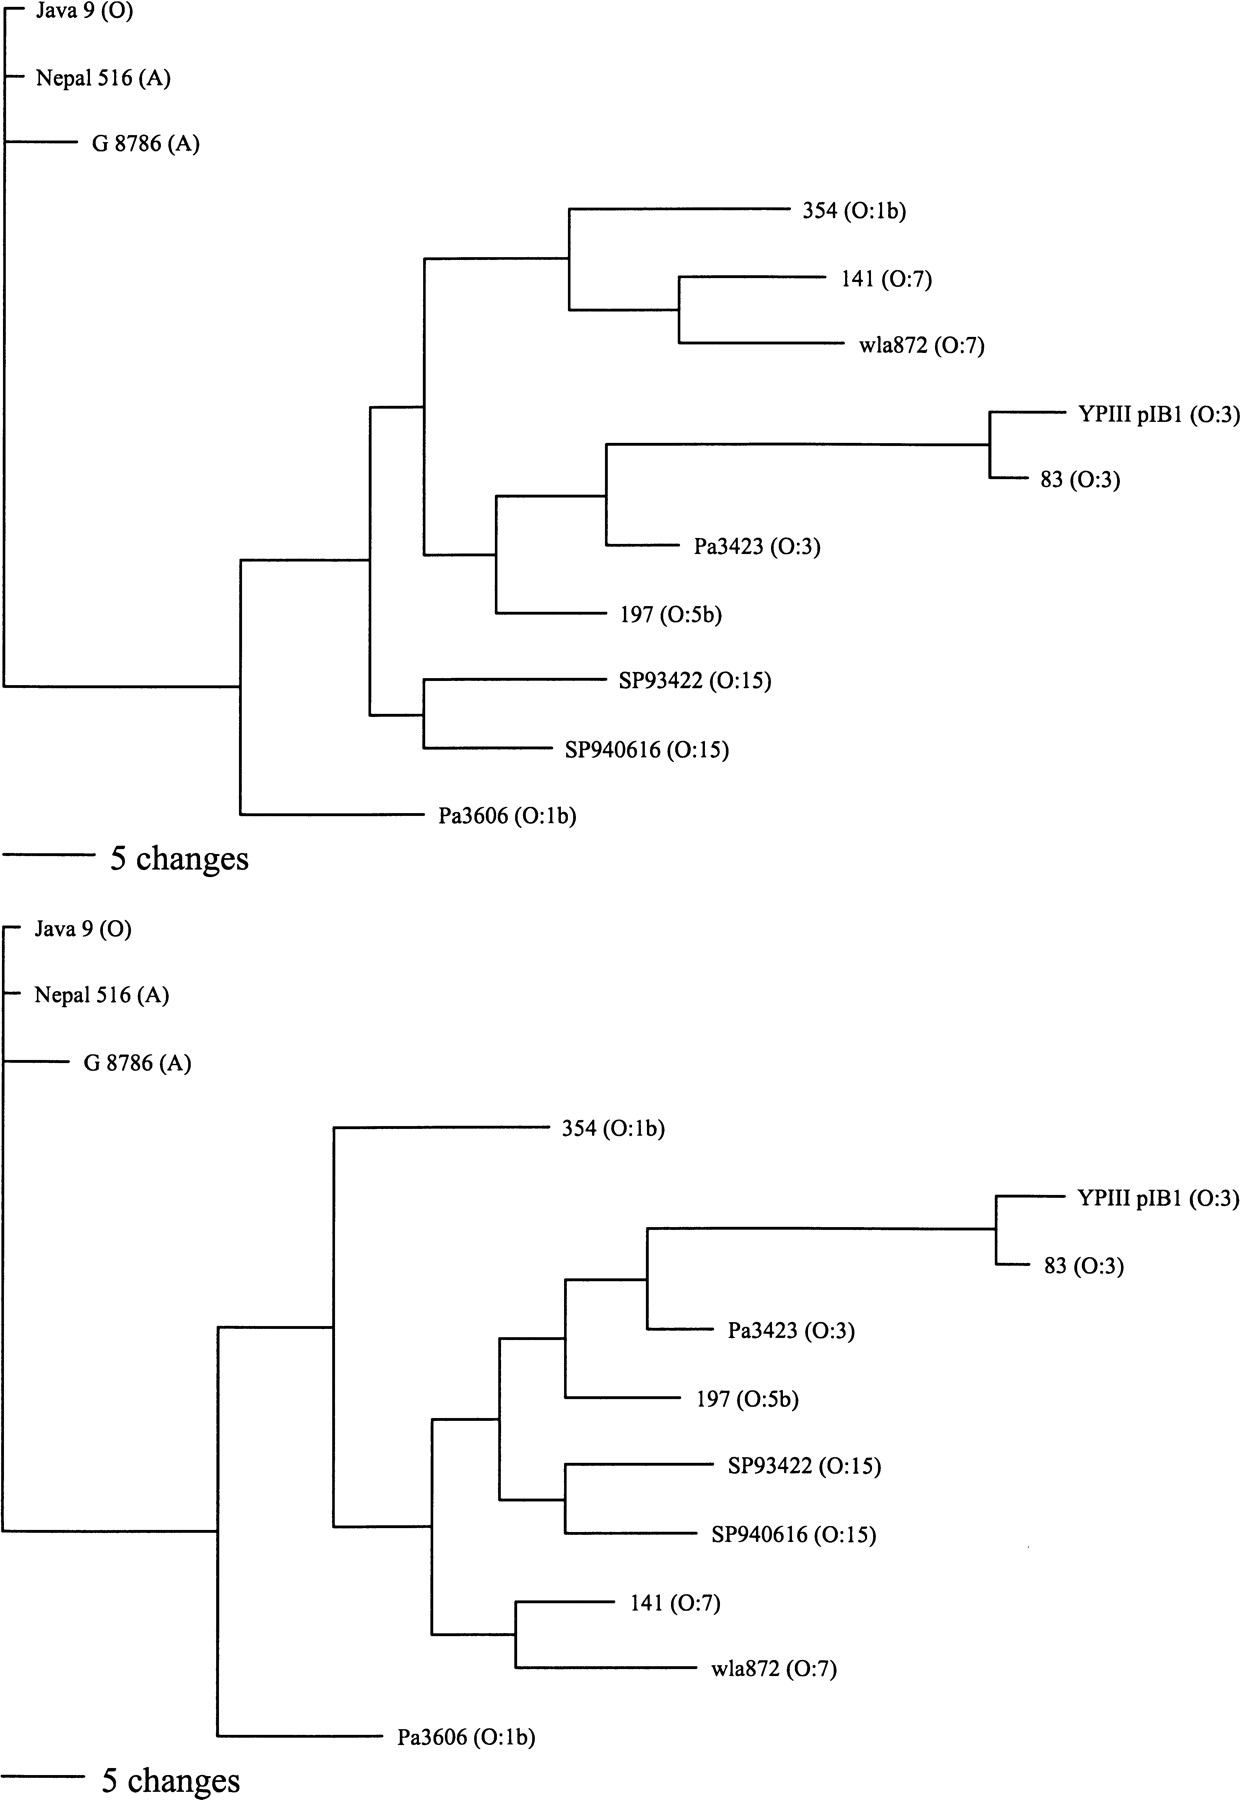
Figure 4
Parsimony analysis of Y. pseudotuberculosis and representative Y. pestis strain microarray data. The two most parsimonious trees are shown. Of 87 variable characters, 63 were parsimony informative and equally weighted. Y. pseudotuberculosis strain names are followed by their serotype in parentheses. Three Y. pestis strains are shown, one from each of the main clades in Fig. 3 and are followed by their biovar in parentheses. Horizontal scale bar indicates number of character changes (Reanalysis omitting all characters pertaining to the O-antigen locus gives a similar result, see Supplemental Data).


