
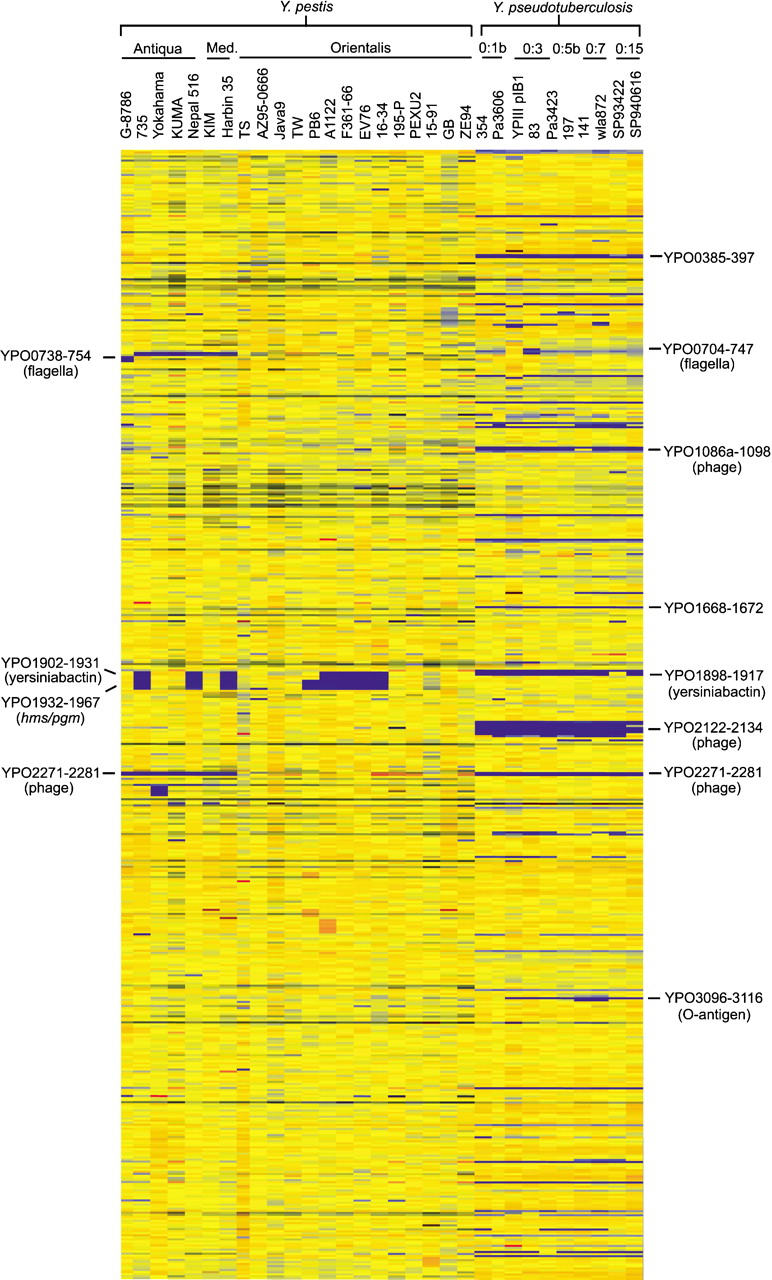
Figure 1
Chromosomal comparison of 22 strains of Y. pestis and 10 strains of Y. pseudotuberculosis to the sequenced CO-92 strain. This data was generated by Genespring software. Y. pestis strains are grouped according to biovar, whereas Y. pseudotuberculosis strains are grouped according to serotype. Gene status is color coded according to the Genespring software default colors with reference to the control strain (CO-92). Thus, in this comparison, yellow indicates presence, blue indicates absence or high divergence, and orange/red indicates a duplication.


