
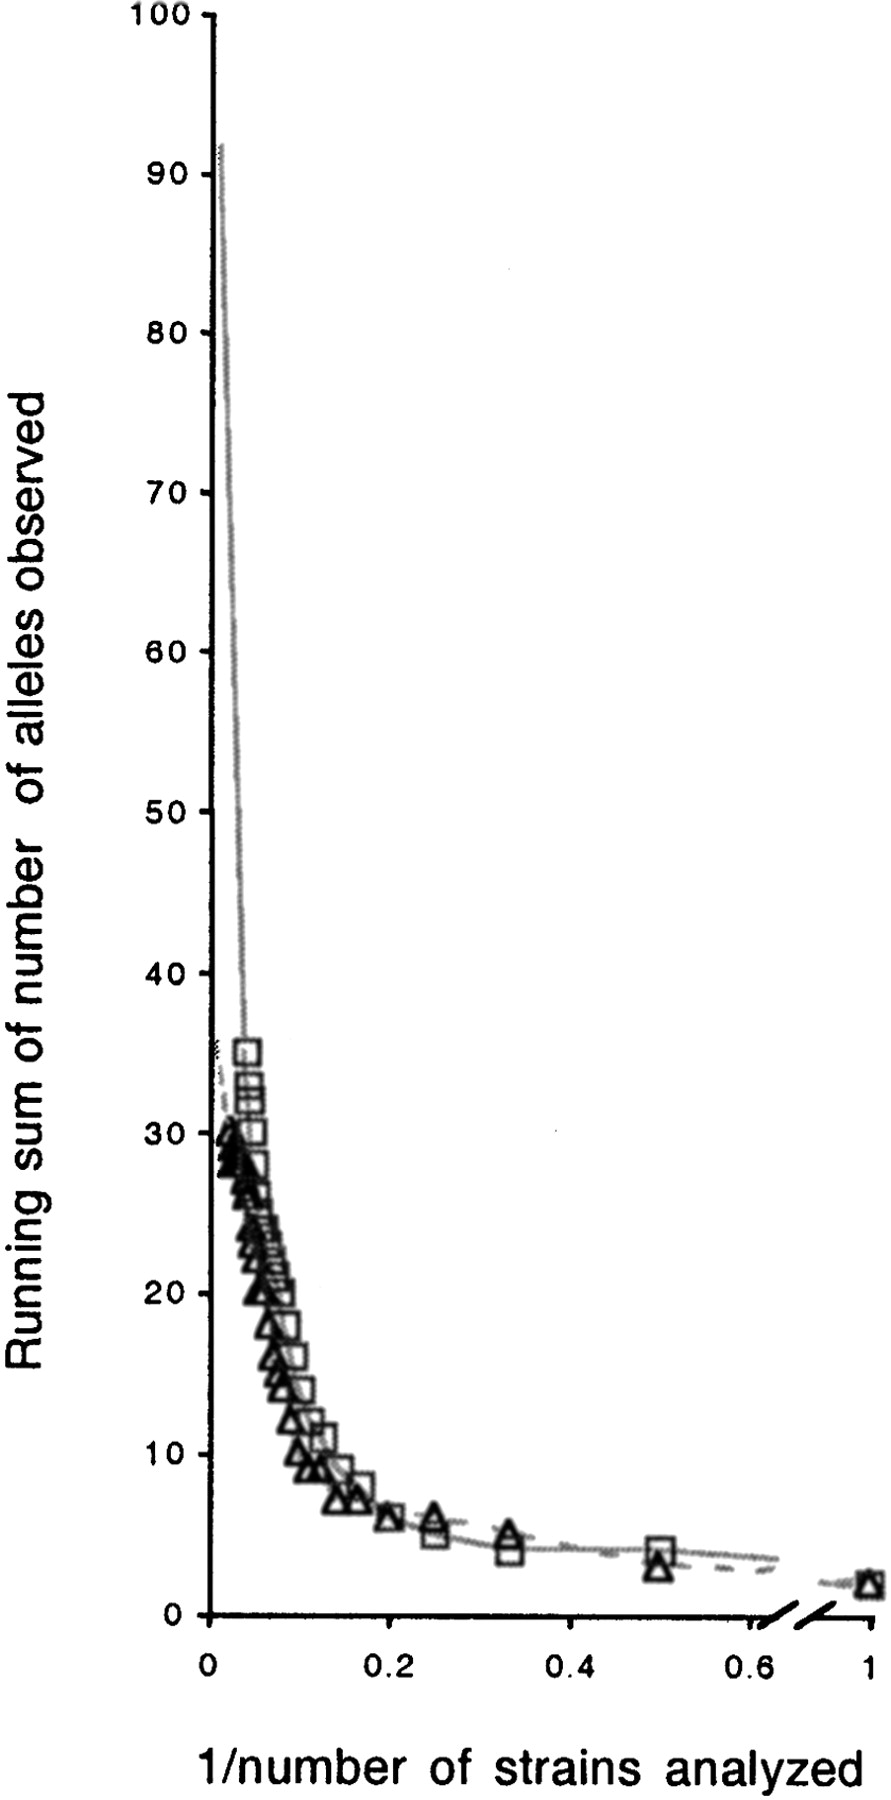
Figure 4
Running sum of the number of different alleles found in cluster strains (triangles, dashed line) and in noncluster strains (squares, solid line) plotted against 1/(running sum) of strains analyzed. The intercept of the trend lines with the y-axis gives an indication of the number of alleles that should be observed if an infinite number of isolates were analyzed.


