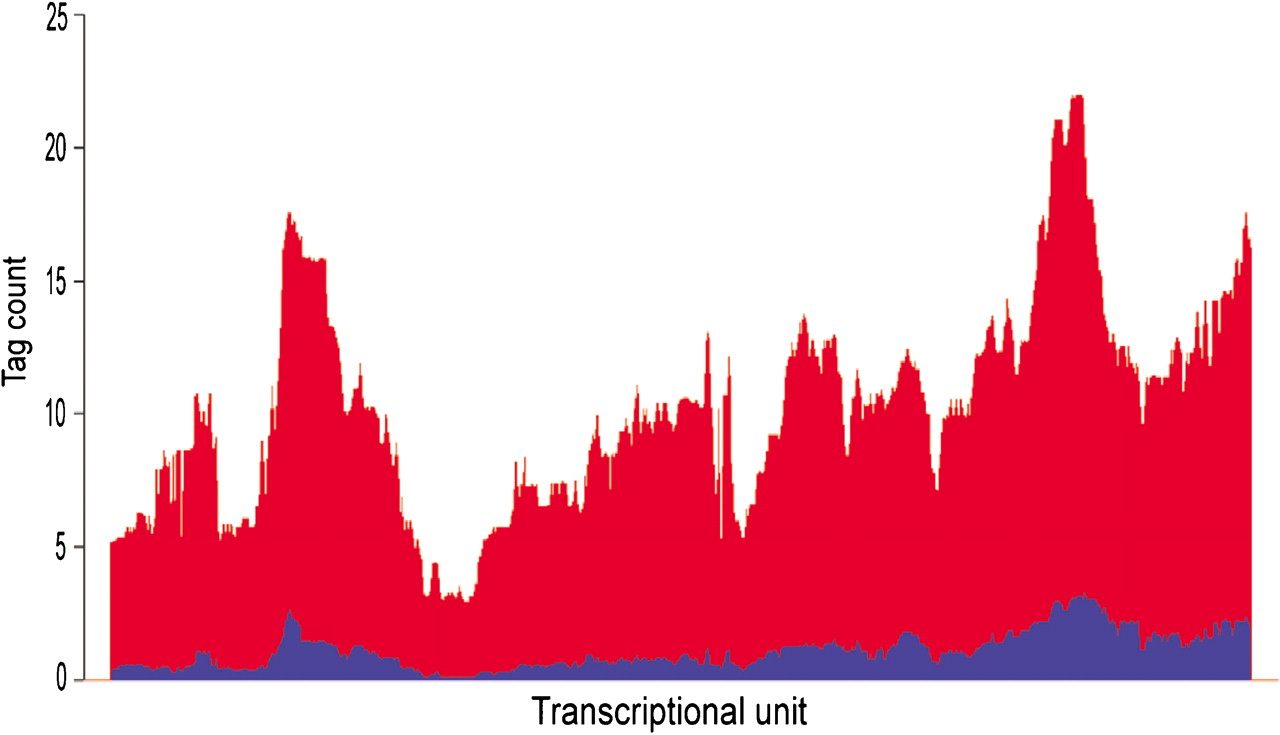
The Human Transcriptome Map Reveals Extremes in Gene Density, Intron Length, GC Content, and Repeat Pattern for Domains of Highly and Weakly Expressed Genes

(Downloading may take up to 30 seconds. If the slide opens in your browser, select File -> Save As to save it.)

Click on image to view larger version.

Figure 5
Figure 5

Both maximal and average gene expressions in a series of SAGE libraries follow the pattern of ridges and antiridges. The profiles of average (blue) and maximal (red) gene expression as found in 57 SAGE libraries of minimally 50,000 SAGE tags are shown for chromosome 9 (w = 49).

This Article

  1. Genome Res. 13: 1998-2004

Preprint Server