
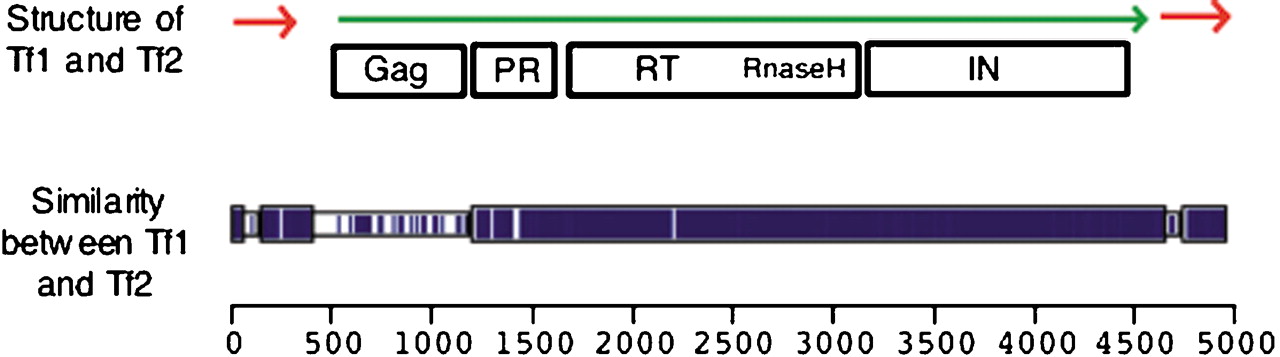
Figure 1
Tf1 and Tf2 diagram. The diagram at the top is the structure of Tf1 and Tf2. The positions of the LTRs are indicated by red arrows. Likewise, the long polyprotein is indicated by a green arrow. The locations of the protein domains are indicated in boxes below the polyprotein. The block diagram at the bottom was constructed with the program Macaw (Schuler et al. 1991) to indicate the regions of identity (shown in blue) between Tf1 and Tf2. The regions of extensive homology are indicated by the taller blue rectangles.


