
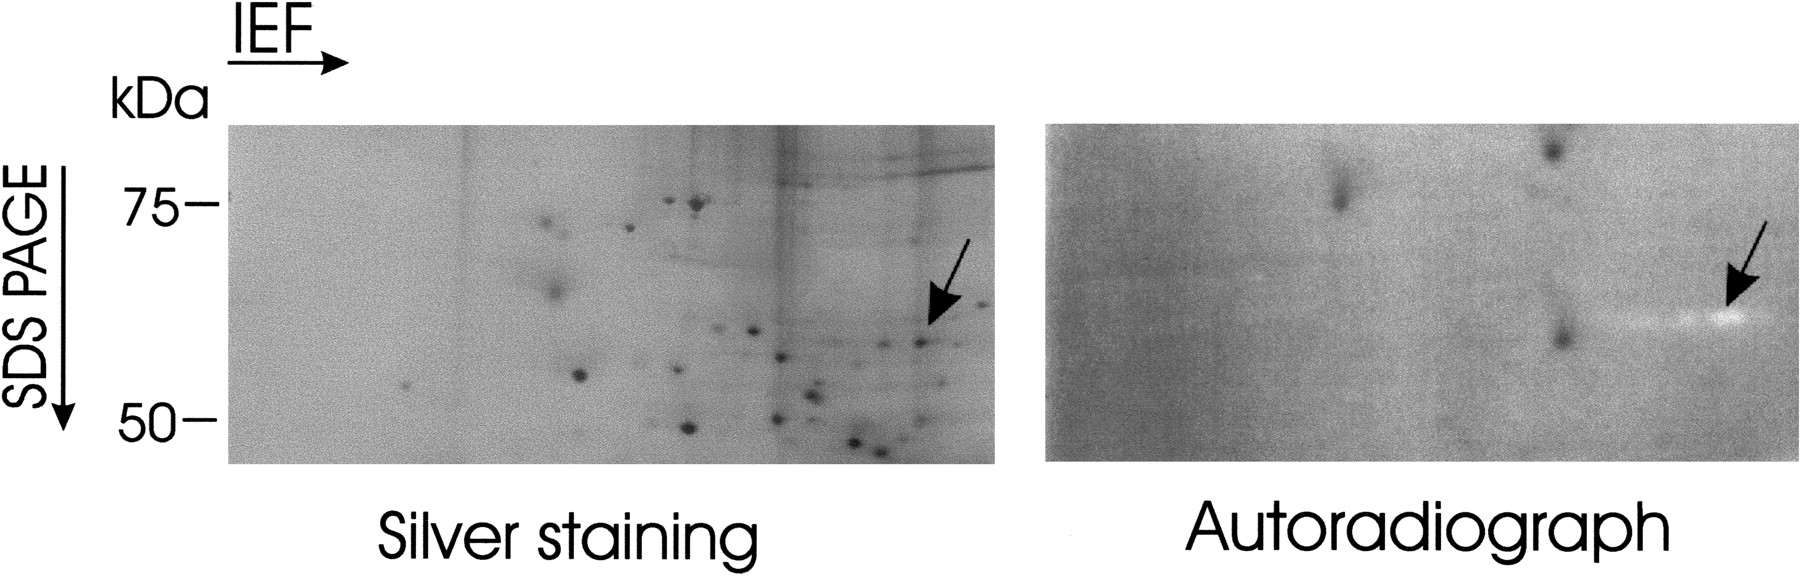
Figure 4
Silver and activity staining of E. coli proteins separated by 2D electrophoresis. The left half of this figure is a silver-stained gel that shows the position of polypeptides following 2D SDS PAGE. The right half is an autoradiography of the same gel that shows the results of an in-gel assay using as substrate the Acr#1 oligonucleotide radiolabeled at the 5′ end. An arrow in each half of the figure indicates the position of spots corresponding to nuclease digestion of the substrates.


