
Figure 6
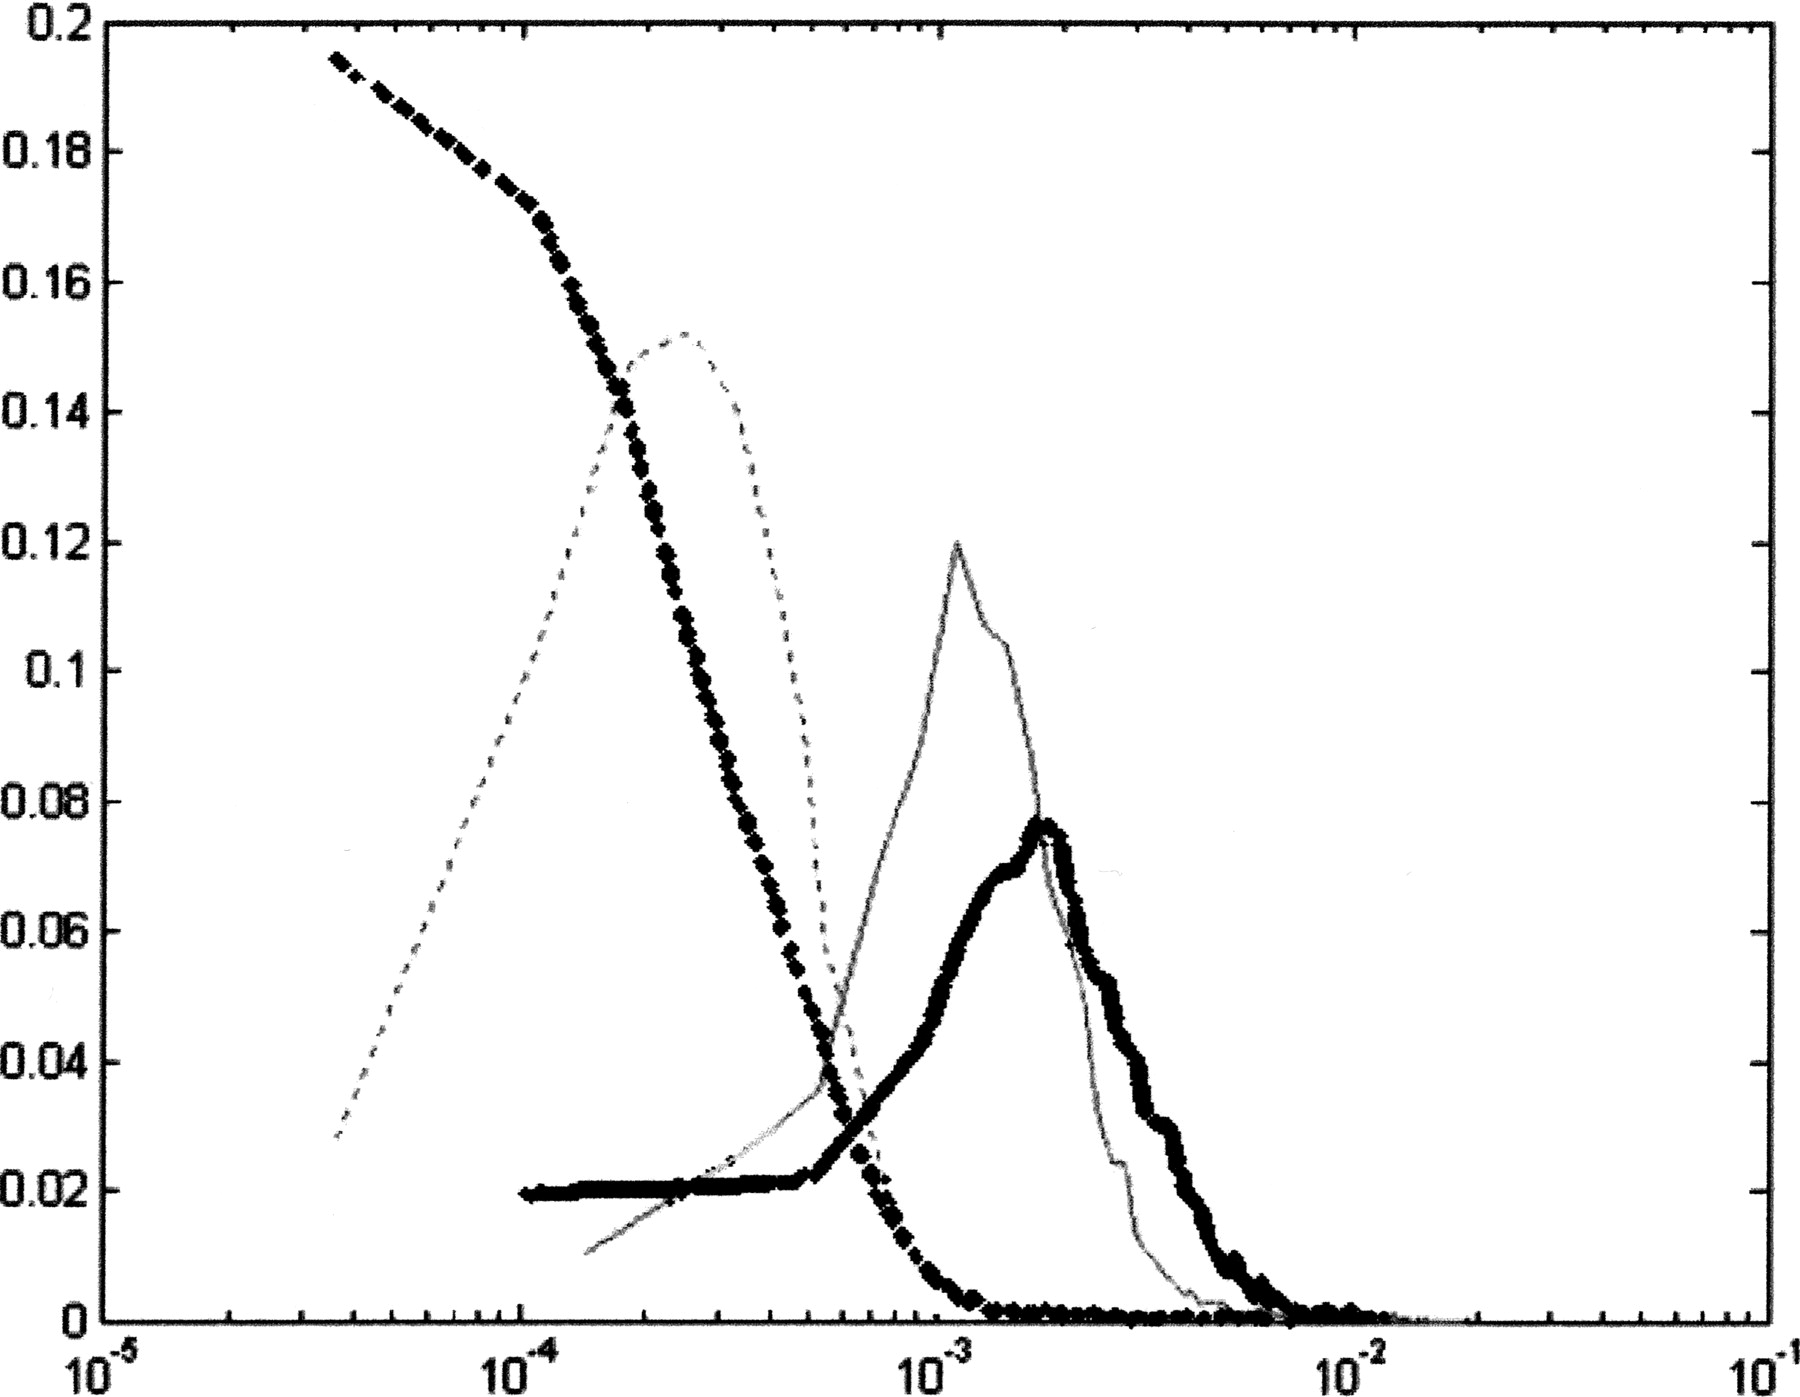
Probability density functions for Spectral Rotation (bold) and Spectral Content (fine) measures (solid lines represent exons and dashed lines represent noncoding regions).
(Downloading may take up to 30 seconds. If the slide opens in your browser, select File -> Save As to save it.)
Click on image to view larger version.
Probability density functions for Spectral Rotation (bold) and Spectral Content (fine) measures (solid lines represent exons and dashed lines represent noncoding regions).
 CiteULike
 Delicious
 Digg
Digg Facebook
 Google+
 Reddit
 Twitter
