
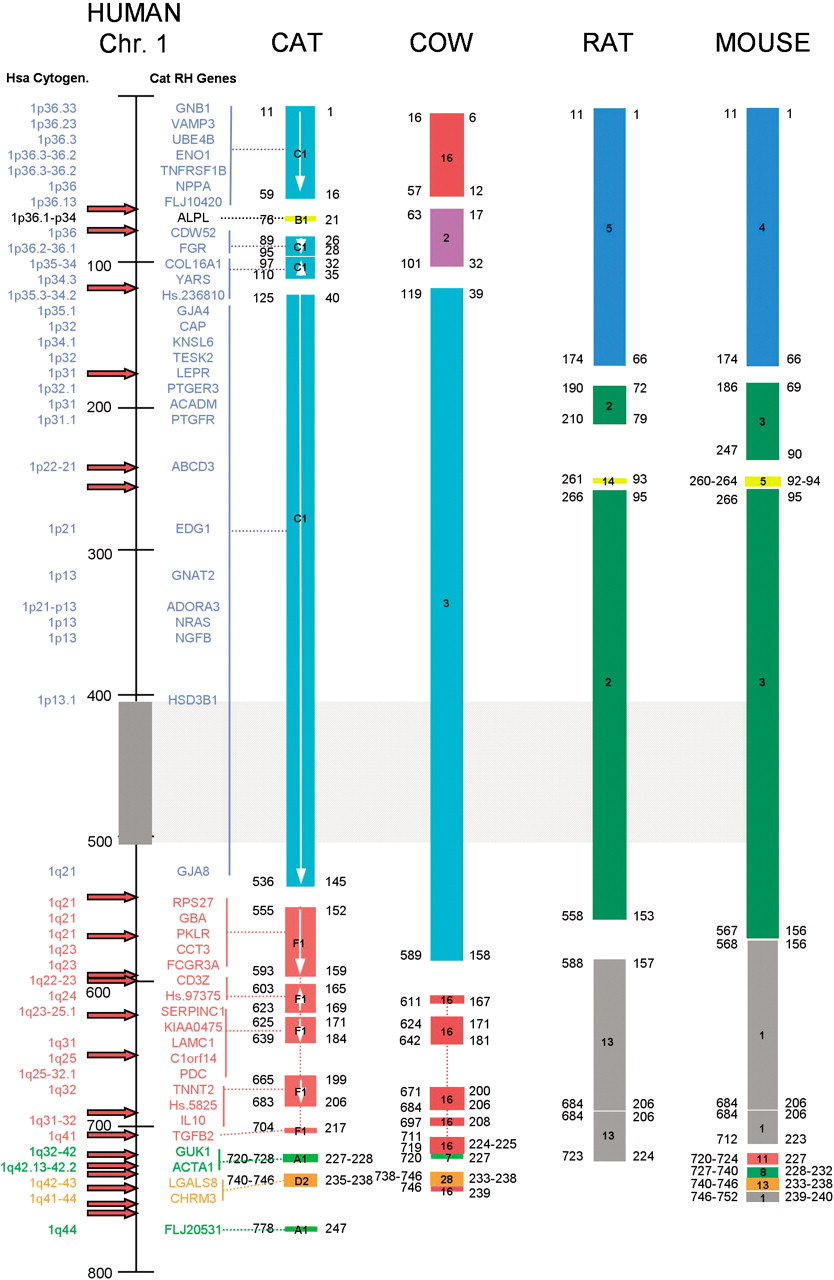
Comparison of cat-ordered conserved segments with published data from cow, mouse, and rat genomes, shown with respect to human chromosome 1 (Hsa1). See Methods for published sources of cat, rat, and mouse gene order data. The genes mapped in the feline genome are marked for comparison, and groups linked to their respective conserved segment indicated by a line. The human cytogenetic position is shown to the far left. The scale to the right of the human cytogenetic position refers to centiray3000 positions on the human Genbridge-4-based RH map. Each colored block represents an ordered conserved segment (CSO) with the human genome, with the internal number referring to the chromosomal origin of the CSO within the genome of each species. White arrows within each feline CSO indicate orientation (p to q) of the human segment within the cat genome. The gray block and hatched box extending to the right, from roughly 410–510 centirays on the human map, indicates the position of the Hsa1 heterochromatic block. The number on the left of the ends of each block refers to the human centiray3000 position of the most distal gene marker in that conserved segment, whereas the number on the right refers to the physical position (in Mb) in the NCBI assembly of the human genome (Build 30). At left of the human RH map, red arrows indicate unique breakpoints relative to the human genome. Breaks were enumerated such that apparent shared breakpoints across species were counted only once. Note the increased density of rearrangement breakpoints on the distal portion of the long arm of Hsa1.


