
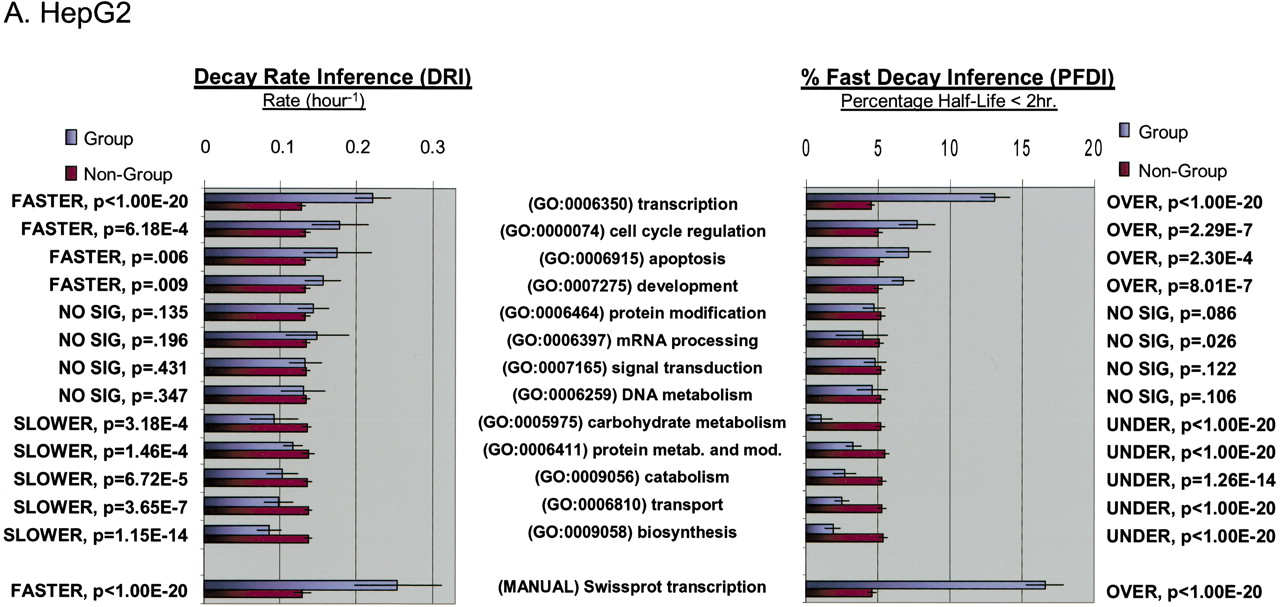
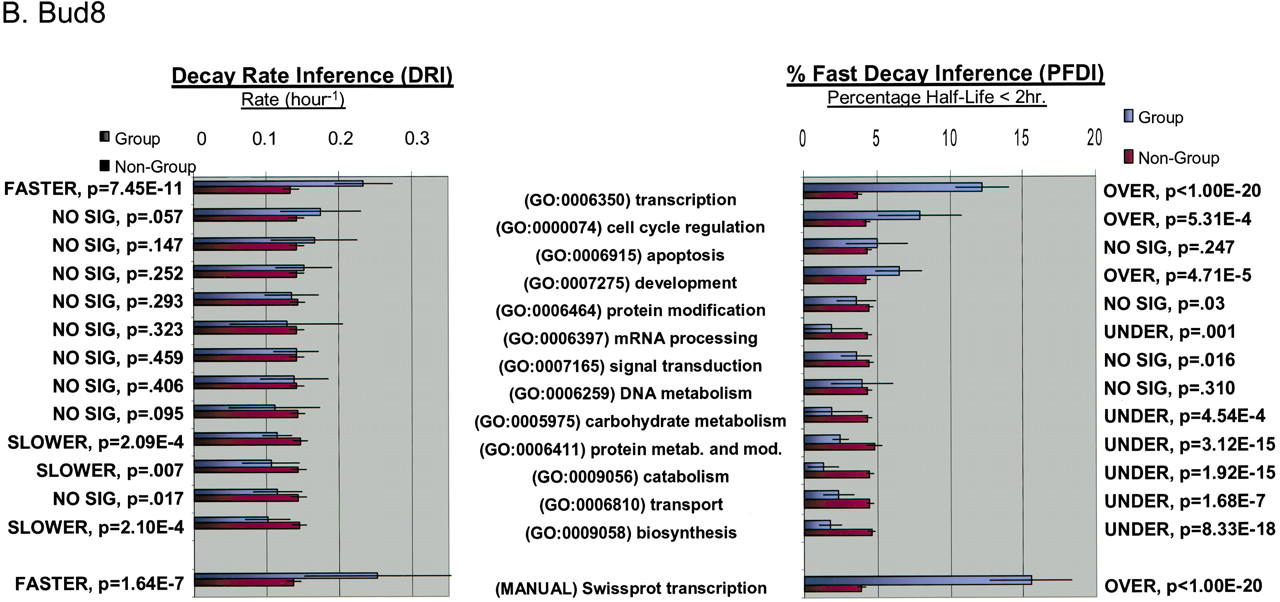
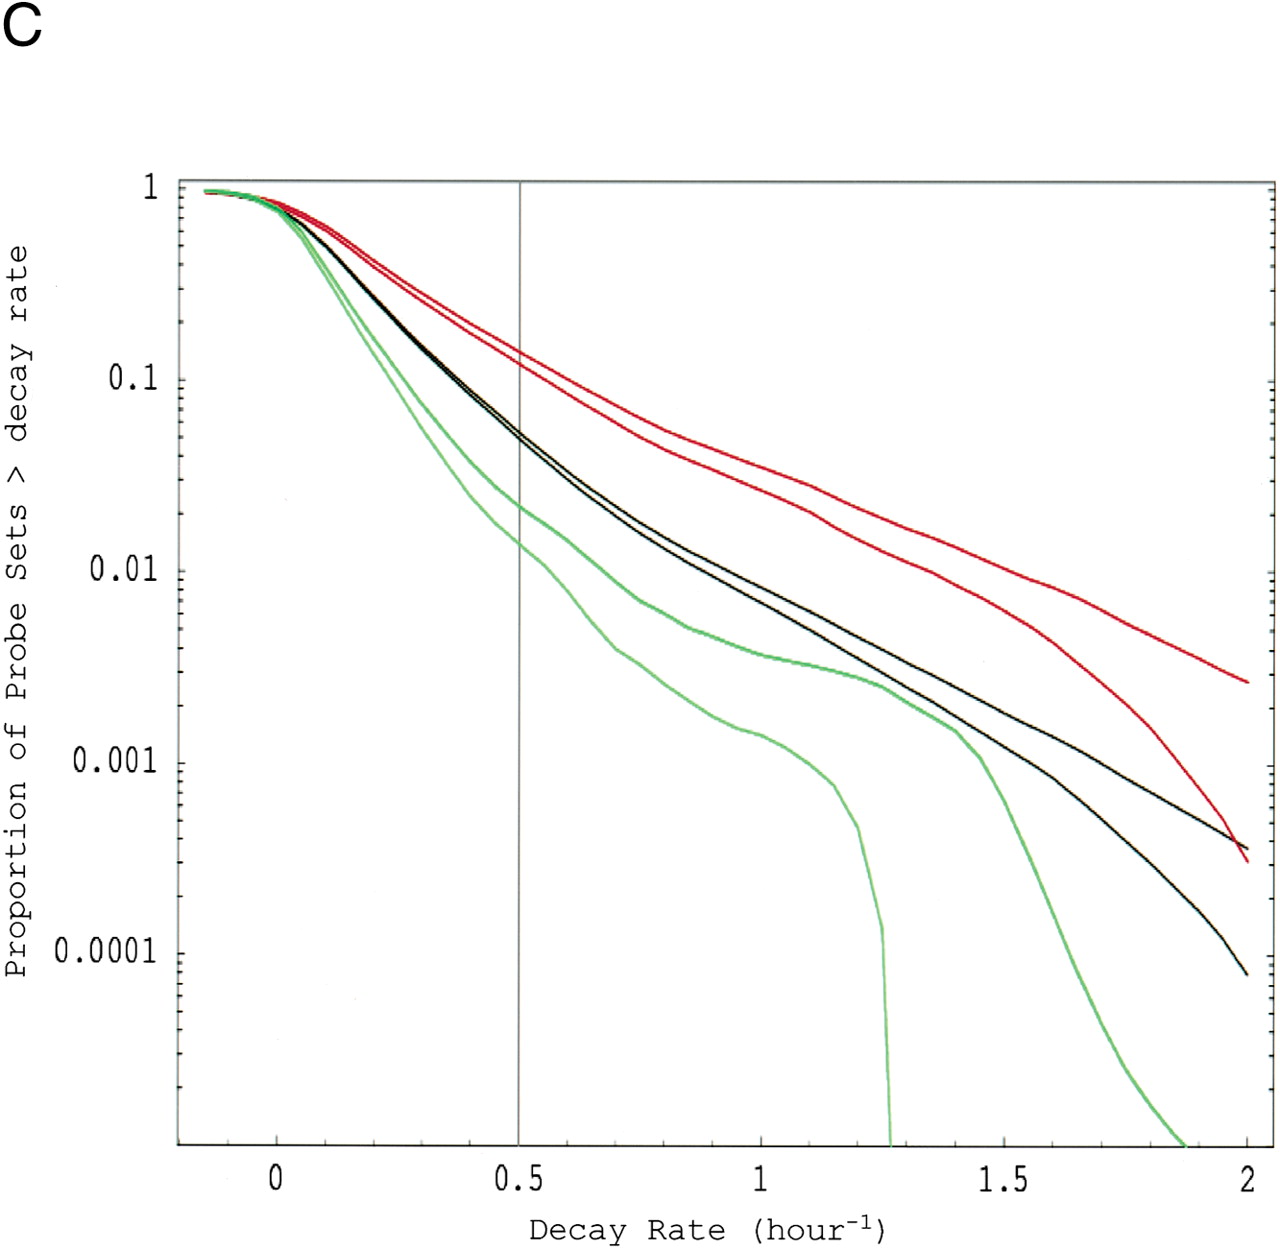
Functional analysis of decaying transcripts in human cells. (A,B) Probe sets from the HepG2 experiments (A) or the Bud8 experiment (B) were grouped by functional (i.e., Gene Ontology, GO) category, and both decay rate and the percentage of fast decayers were inferred using procedures we call DRI and PFDI (see Methods: Statistical Analysis and Decay Rate Calculations). For DRI, the average decay rates were calculated (error bars denote 99% posterior probability interval (PPI)) for probe sets corresponding to the functional category listed in the center (Group, blue). If the GO category in question was separated from the rest of the probe sets (Nongroup, purple) with >99% probability (see p-values to left), the distribution was described as “FASTER” or “SLOWER” as appropriate. Otherwise, the GO distribution was said to be “NO SIG” (not significantly) different from the other probe sets. For PFDI, the percentage of probe sets (error bars again denote 99% PPI) decaying with a rate >0.5 h-1 (2 h half-life) were calculated for probe sets inside of the stated GO category (Group) or outside the category (Nongroup). If the GO category's probe sets were enriched/depleted in the rapid turnover pool with at least 99% probability (see p-values to the right), the category was said to be “OVER” (overrepresented) or “UNDER” (underrepresented), respectively. Otherwise, the category was listed as “NO SIG” (no significant) enrichment. For comparison, the same analysis (“MANUAL”) was performed using a set of probe sets corresponding to SWISS-PROT entries annotated as transcription-related (see Methods). (C) Reverse cumulative distribution of decay rates for probe sets in different functional classes (HepG2 experiments). Decay rate r is shown horizontally, while vertically the fraction of probe sets with decay rates higher than r is plotted on a logarithmicscale. The pairs of lines show the 98% posterior probability intervals for the fraction at each value of r. (Red) GO process transcription; (black) all probe sets; (green) biosynthesis. The gray line indicates the decay rate r = 0.5 h-1, which is our cutoff for fast decay in PFDI.


