
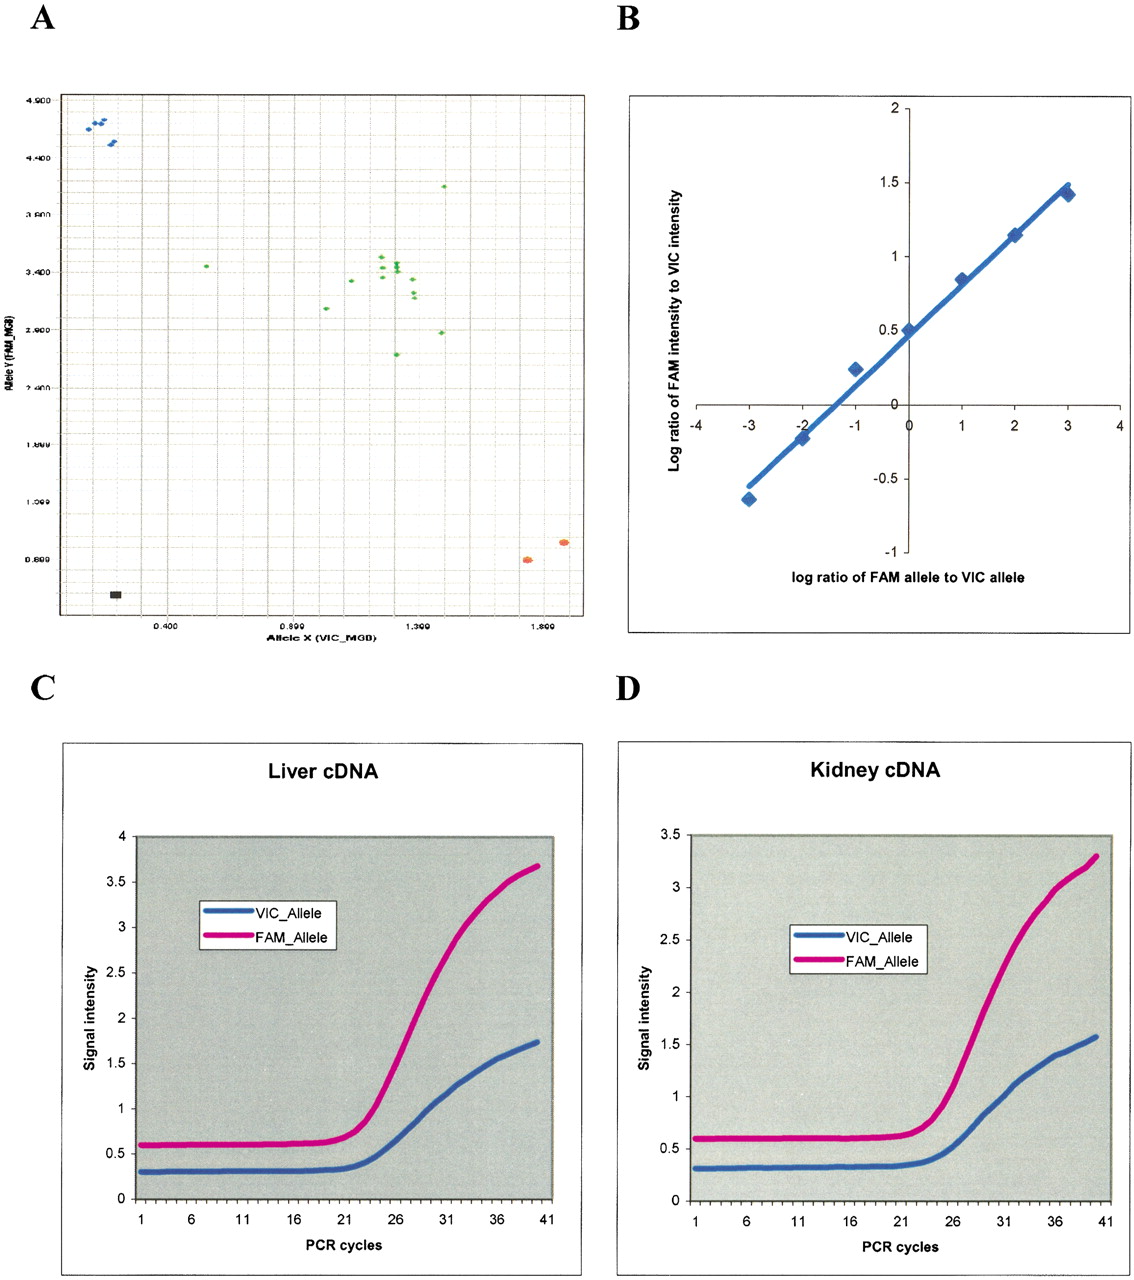
Validation of allele-specific gene expression using real-time quantitative PCR. (A) Genotyping of ELAC2 in 23 fetuses. Genomic DNAs from homozygous AA fetuses are at top left corner (blue), and genomic DNAs from homozygous BB fetuses are at bottom right corners (red). Genomic DNAs from heterozygous fetuses are located near the diagonal line (green). The black square represents no template control (NTC). The X-axis is for allele labeled by the VIC dye, and the Y-axis is for allele labeled by the FAM dye. (B) The log2 of (FAM intensity/VIC intensity) for ELAC2 was plotted against log2 of (FAM allele/VIC allele) of mixing homozygous DNAs at seven different ratios (8: 1, 4: 1, 2: 1, 1: 1, 1: 2, 1: 4, 1: 8; VIC allele/FAM allele). (C) Real-time quantitative PCR amplification of a cDNA sample from liver for ELAC2. The X-axis is the number of PCR amplification cycles, and the Y-axis is the fluorescence intensity. The red and blue curves represent alleles labeled with FAM and VIC, respectively. (D) Same as C except that the data are from kidney.


