


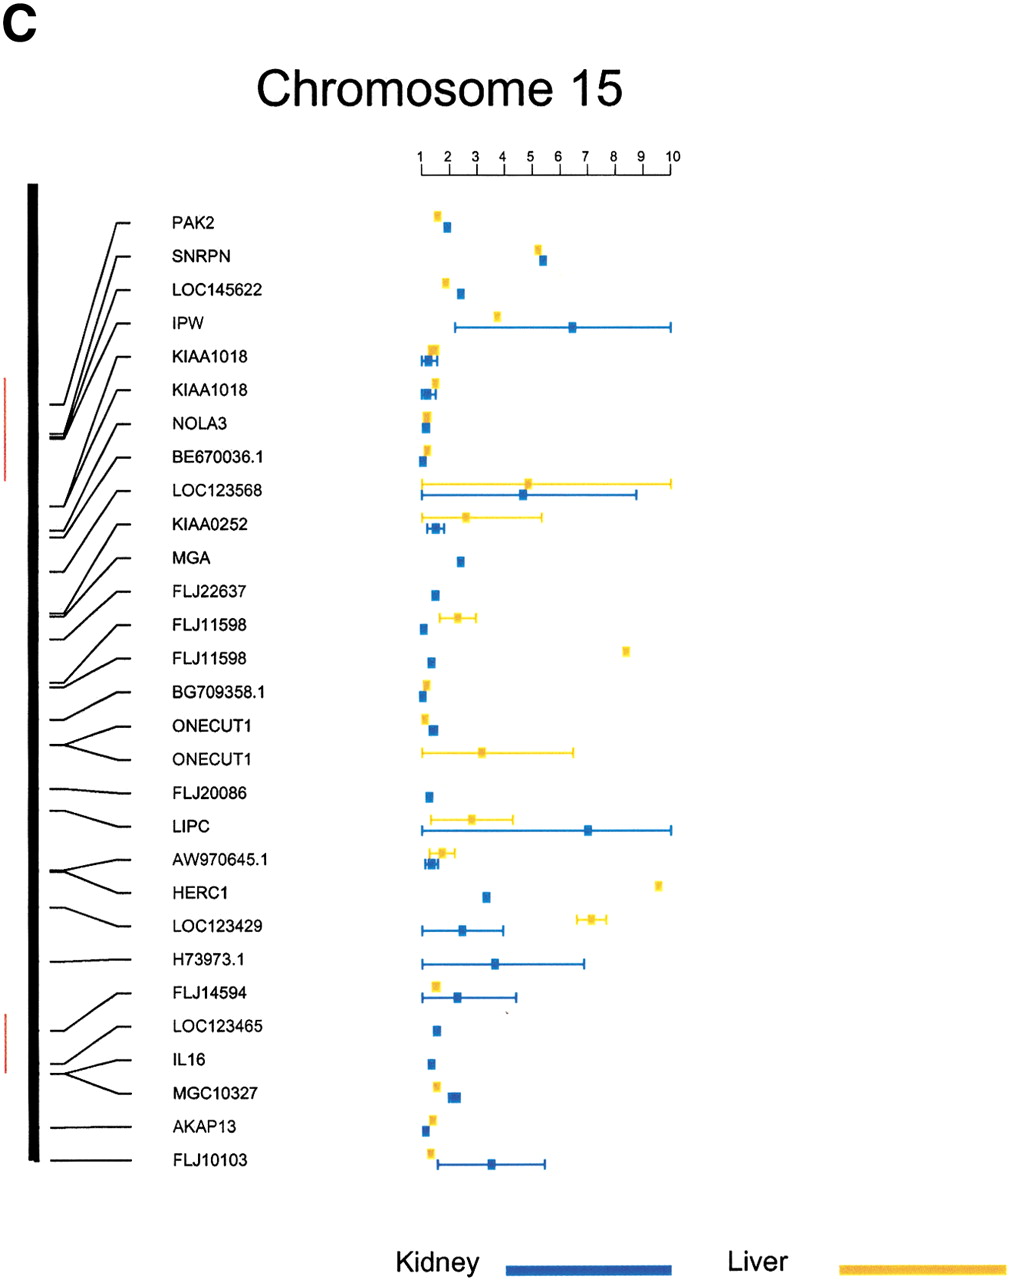
Mapping of allelic gene expression on chromosomes. The 602 SNPs analyzed in this study were mapped to the 22 autosomes and X chromosome (Supplemental Fig. 1). Chromosomes 9, 13, and 15 are shown here. The position of each SNP on the chromosome is based on the annotation in dbSNP. Allelic gene expression from kidney and liver is represented by blue and orange, respectively. Squares indicate the mean of the ratios for each gene, and the thin vertical lines indicate error bars (SD). The values are the ratios (allele A/allele B) between the two alleles. The values were inverted if less than one (allele B/allele A, when allele B was preferentially expressed). The scale marks ratios from one to 10. The chromosomal regions containing known imprinted genes are labeled with the red line on the left.


