
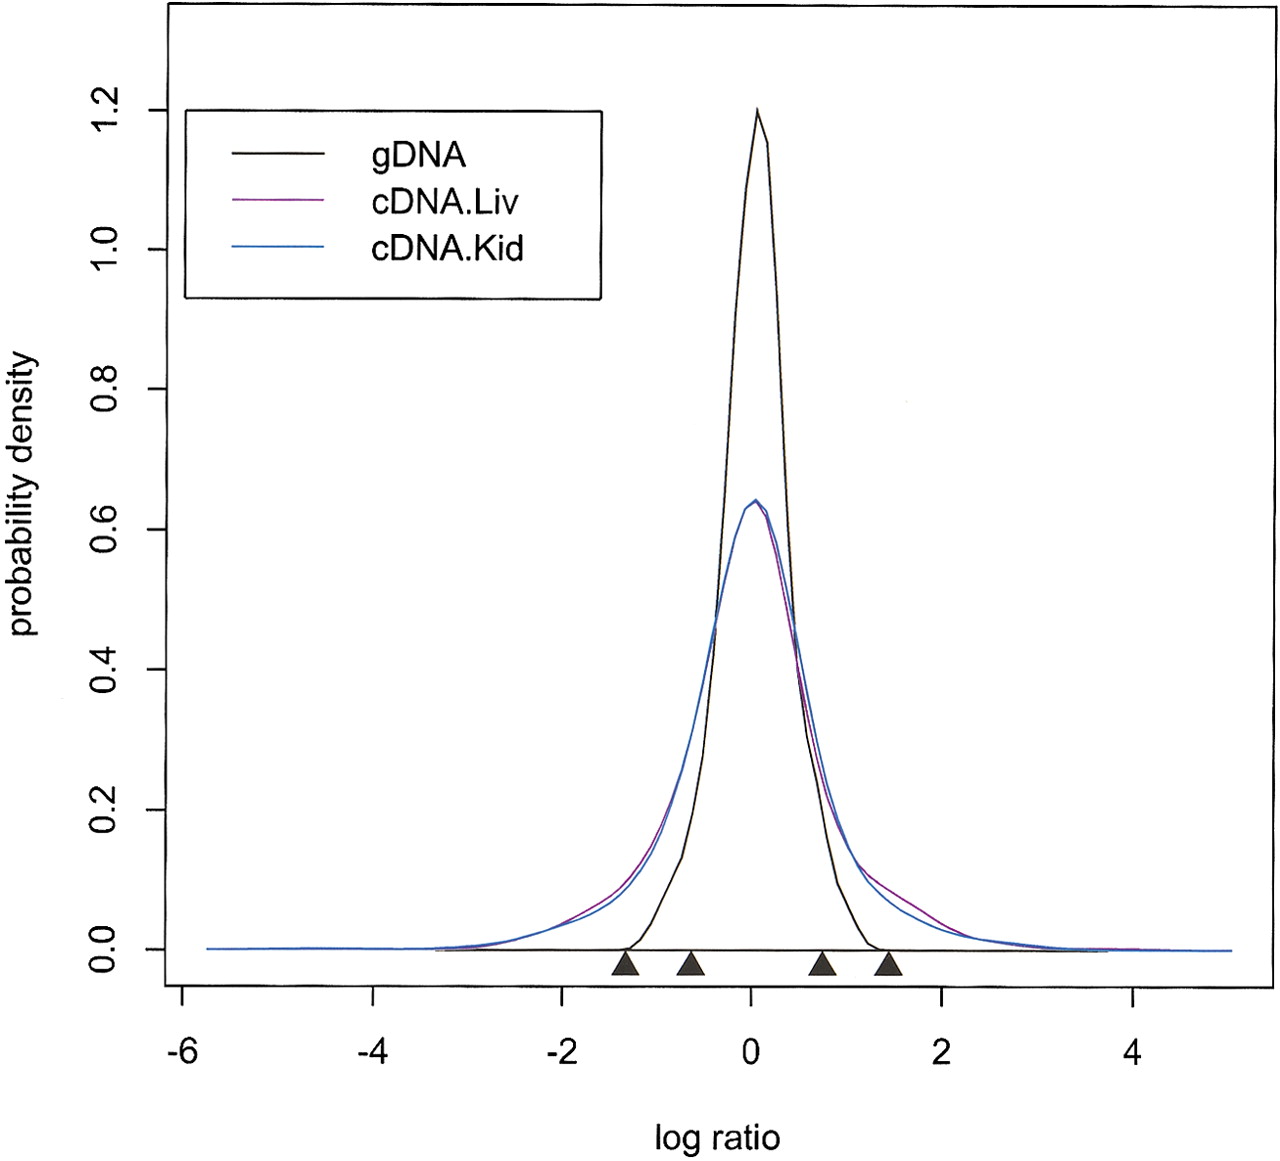
Distribution of ratios of the fluorescent intensities between the two alleles for genomic DNA and cDNA. The ratios were computed as (PMA - MMA)/(PMB - MMB) for each SNP for every sample. From the ratios in genomic DNA samples, the 1-SD interval around the mean is between -1.27 and 1.17 in log scale. The interval in log scale corresponds to the interval between 0.28 and 3.22 for the ratios. We selected 602 SNPs for analysis (for selection criteria, see Methods). To compare the distributions of ratios in genomic DNA and cDNA, we plotted frequency of samples against the log ratio. Density functions for genomic DNA, kidney cDNA, and liver cDNA are represented by a black line, blue line, and purple line, respectively. Black triangles, from left to right, indicate X coordinates at log(0.25), log(0.5), log(2), and log(4). The coordinates at log(0.5) and log(2) represent twofold ratios, and log(0.25) and log(4) represent fourfold ratios. The density functions for the kidney cDNA ratios and the liver cDNA ratios are similar. Both have a wider spread compared to the density function for the genomic DNA.


